
Fintech PR
Citycon H1/2023: Compounding operational growth
CITYCON OYJ Half-Year Financial Report 18 July 2023 at 20:30 hrs
HELSINKI, July 18, 2023 /PRNewswire/ — CITYCON Q1-Q2/2023 RESULTS SUMMARY:
FINANCIAL & KEY PERFORMANCE INDICATORS
Like-for-Like (‘LFL’) Net Rental Income
Excludes acquisitions, dispositions, development, and closed asset (Torvbyen)
- Q1-Q2/2023, increased 6.9% (comparable FX) vs. Q1-Q2/2022
- Q2/2023, increased 4.5% (comparable FX) vs. Q2/2022
Q2/2022 was positively impacted by several one-time benefits resulting in difficult Q2/2023 comparisons. Excl. these one-time items:
- Q1-Q2/2023, increased 7.8% (comparable FX) vs. Q1-Q2/2022
- Q2/2023, increased 7.5% (comparable FX) vs. Q2/2022
- Q2/2023 compounding growth achieved versus last year as Q2/2022 LFL NRI growth was 9.1% vs. Q2/2021.
Standing Net Rental Income
Excl. four assets disposed in Norway in 2022
- Q1-Q2/2023, increased 5.5% (comparable FX) vs. Q1-Q2/2022
- Q2/2023, increased 2.6% (comparable FX) vs. Q2/2022
In addition, Q1-Q2/2023 was further impacted by the closing of Torvbyen in Norway. Excl. the adverse impact of these two combined items:
- Q1-Q2/2023, increased 7.9% (comparable FX) vs. Q1-Q2/2022
- Q2/2023, increased 7.2% (comparable FX) vs. Q2/2022
All Net Rental Income
- FX-rate impact to total NRI was EUR -5.8 million in Q1-Q2/2023
- On a sequential basis, Q2/2023 NRI grew 2% over Q1/2023
KPI’s
- Q1-Q2/2023 LFL tenant sales +4.1%
- +9.7% vs. Q1-Q2/2019 (pre-pandemic)
- Q1-Q2/2023 LFL footfall +3.1%
- Q2/2023 retail occupancy 95.5%
-
- +10 bps vs. Q1/2023
- +50 bps increase from Q2/2022
- Q2/2023 collections were 97%
- Q1/2023 improved to 99% from 97%
- Q1-Q2/2023 average rent per sqm increased EUR 1.5 (+6.8%) to EUR 24.0 (comparable FX)
- Q2/2023 9.4% LFL occupancy cost ratio
BALANCE SHEET
Liability Management
- Replacement and extension of EUR 650 million credit facility in April 2023, incl. EUR 250 million term loan
- Q2/2023 Tendered EUR 138 million of 2024 senior bonds (notional)
- Q2/2023 Purchased additional EUR 15.7 million of notional bonds in open market
- Q1-Q2/2023 total notional bond and hybrid repurchases of EUR 235 million for EUR 211 million cash
Fair Value
- Q1-Q2/2023 net fair value improved EUR 69.4 million
- Q2/2023 net fair value improved EUR 24.7 million
SUSTAINABILITY
- 3rd consecutive year as Financial Times European Climate Leader
- Only Finnish real estate company included on the list; top third of all European companies regardless of sector.
- Recently updated sustainability strategy
- Setting ambitious goals for 2030
|
STANDING PORTFOLIO KEY FIGURES 1) |
|||||||
|
Q2/2023 |
Q2/2022 |
% |
FX Adjusted |
FX Adjusted % 4)  |
|||
|
Net rental income |
MEUR |
48.9 |
51.0 |
-4.1 % |
47.7 |
2.6 % |
|
|
Direct operating profit 2) |
MEUR |
42.2 |
44.6 |
-5.3 % |
41.5 |
1.6 % |
|
|
EPRA based key figures 2) |
|||||||
|
EPRA Earnings |
MEUR |
26.6 |
30.4 |
-12.5 % |
28.3 |
-6.0 % |
|
|
Adjusted EPRA Earnings 3) |
MEUR |
19.5 |
22.8 |
-14.6 % |
20.7 |
-6.0 % |
|
|
EPRA Earnings per share (basic) |
EUR |
0.159 |
0.181 |
-12.5 % |
0.169 |
-6.0 % |
|
|
Adjusted EPRA Earnings per share (basic) 3) |
EUR |
0.116 |
0.136 |
-14.6 % |
0.123 |
-6.0 % |
|
|
Q1-Q2 |
Q1-Q2/ |
% |
FX Adjusted |
FX Adjusted % 4) |
Q1-Q4/2022 |
||
|
Net rental income |
MEUR |
96.8 |
97.0 |
-0.3 % |
91.7 |
5.5 % |
195.1 |
|
Direct operating profit 2) |
MEUR |
80.5 |
81.9 |
-1.7 % |
77.2 |
4.3 % |
166.2 |
|
EPRA based key figures 2) |
|||||||
|
EPRA Earnings |
MEUR |
51.9 |
55.7 |
-6.8 % |
52.3 |
-0.7 % |
113.6 |
|
Adjusted EPRA Earnings 3) |
MEUR |
37.4 |
40.6 |
-8.0 % |
37.2 |
0.5 % |
83.1 |
|
EPRA Earnings per share (basic) |
EUR |
0.309 |
0.332 |
-6.8 % |
0.311 |
-0.7 % |
0.676 |
|
Adjusted EPRA Earnings per share (basic) 3) |
EUR |
0.222 |
0.242 |
-8.0 % |
0.221 |
0.5 % |
0.495 |
|
1)Standing portfolio key figures include only income and expenses from investment properties that were on group balance sheet on 30 June 2023. The portfolio is the same in the reporting period and in the comparison period, hence the numbers are comparable. Lippulaiva (opened on the 31st of March 2022) is included in the standing portfolio. |
|||||||
|
KEY FIGURES |
|||||||
|
Citycon Group 1) |
Q2/2023 |
Q2/2022 |
% |
FX Adjusted |
FX Adjusted % 2) |
||
|
Net rental income |
MEUR |
48.9 |
52.8 |
-7.3 % |
49.2 |
-0.6 % |
|
|
Like-for-like net rental income development |
% |
4.5 % |
9.1 % |
– |
– |
– |
|
|
Direct operating profit 3) |
MEUR |
42.2 |
46.3 |
-8.9 % |
43.0 |
-2.0 % |
|
|
IFRS Earnings per share (basic) 4) |
EUR |
0.18 |
0.13 |
41.2 % |
0.11 |
56.0 % |
|
|
Fair value of investment properties |
MEUR |
3 979.0 |
4 216.9 |
-5.6 % |
– |
– |
|
|
Loan to Value (LTV) 3) 6) |
% |
43.0 |
40.8 |
5.4 % |
– |
– |
|
|
EPRA based key figures 3) |
|||||||
|
EPRA Earnings |
MEUR |
26.6 |
32.2 |
-17.4 % |
29.8 |
-10.9 % |
|
|
Adjusted EPRA Earnings 5) |
MEUR |
19.4 |
24.6 |
-20.8 % |
22.2 |
-12.5 % |
|
|
EPRA Earnings per share (basic) |
EUR |
0.158 |
0.192 |
-17.4 % |
0.178 |
-10.9 % |
|
|
Adjusted EPRA Earnings per share (basic) 5) |
EUR |
0.116 |
0.146 |
-20.8 % |
0.132 |
-12.5 % |
|
|
EPRA NRV per share 7) |
EUR |
10.71 |
11.87 |
-9.8 % |
– |
– |
|
Q1-Q2 |
Q1-Q2 |
% |
FX Adjusted |
FX Adjusted % 2) |
Q1-Q4/2022 |
||
|
Net rental income |
MEUR |
96.7 |
101.8 |
-5.0 % |
96.0 |
0.8 % |
203.6 |
|
Like-for-like net rental income development |
% |
6.9 % |
6.1 % |
– |
– |
– |
6.6 % |
|
Direct operating profit 3) |
MEUR |
80.4 |
86.4 |
-7.0 % |
81.3 |
-1.0 % |
175.2 |
|
IFRS Earnings per share (basic) 4) |
EUR |
0.50 |
0.26 |
91.5 % |
0.24 |
– |
-0.15 |
|
Fair value of investment properties |
MEUR |
3 979.0 |
4 216.9 |
-5.6 % |
– |
– |
4 040.1 |
|
Loan to Value (LTV) 3) 6) |
% |
43.0 |
40.8 |
5.4 % |
– |
– |
41.4 |
|
EPRA based key figures 3) |
|||||||
|
EPRA Earnings |
MEUR |
51.9 |
60.3 |
-14.0 % |
56.4 |
-8.0 % |
122.6 |
|
Adjusted EPRA Earnings 5) |
MEUR |
37.3 |
45.2 |
-17.4 % |
41.3 |
-9.6 % |
92.1 |
|
EPRA Earnings per share (basic) |
EUR |
0.309 |
0.359 |
-14.0 % |
0.336 |
-8.0 % |
0.730 |
|
Adjusted EPRA Earnings per share (basic) 5) |
EUR |
0.222 |
0.269 |
-17.4 % |
0.246 |
-9.6 % |
0.548 |
|
EPRA NRV per share 7) |
EUR |
10.71 |
11.87 |
-9.8 % |
– |
– |
11.01 |
|
1)The numbers include the sale of four investments properties during the last year |
|||||||
CEO F. SCOTT BALL:
We continue to see strong performance in our business fundamentals in the first half of the year as like-for-like tenant sales were 4.1% above Q1-Q2/2022 and 9.7% above Q1-Q2/2019 pre-pandemic levels. We also are seeing more customers in our centres as like-for-like footfall increased 3.1% compared to the previous year. Retail occupancy is now at 95.5%, up 50 bps versus the same quarter last year. At the same time, average rent per square meter, with comparable FX rates, increased by 1.5 EUR/s.qm. (6.8% to 24.0 EUR per sq.m.) during the first half the year. We continue to benefit from a low occupancy cost ratio of 9.4%, which together with increasing tenant sales and improving footfall, positions Citycon for continued compounding rent growth and service charge increases. Sales increases keeping pace with inflation were evident in our continued high collection rates of 97% in Q2/2023, with Q1/2023 collection improving to 99%. In the first half of the year, these metrics supported our underlying asset values where we recorded a net fair value gain of EUR 69.4 million for Q1-Q2/2023, reflecting the impact of compounding rent growth due to indexation linked leases (93% of our leases).
The net effect of these strong KPI’s is that like-for-like net rental income grew nearly 8%, when excluding one-time items. On a sequential basis, Q2/2023 net rental income grew 2% over Q1/2023 net rental income. In the first half of this year there has been adverse volatility of currencies (which is outside of our control), specifically the NOK and SEK are at twenty-year lows. Each quarter we translate these currencies back to the euro for reporting purposes. These currencies will likely rebound at some point, at which time we will benefit. More details on the impact of currency through H1/2023 are included within the report.
There are several factors which explain these results: our terrific assets, our strong local teams, the strength of our markets throughout the Nordics and continued strength of consumers, as evidenced by the high level of foot traffic in our assets and the corresponding sales being reported by our tenants. This is due, in part, to our business model, which focuses on necessity-based retail and essential services addressing the every-day-needs of our communities. This type of retail promotes daily traffic to our properties, which is only enhanced by locations in central urban areas adjacent to public rail/bus transportation hubs. Another driver of the consumer strength phenomenon is the average wage growth (5.5%) that has occurred in our markets due to inflation. As is typical in an inflationary environment, price increases work though the entire chain: wages, cost of goods/services, higher sales, and ultimately, for Citycon, higher rents.
As noted in our Q1/2023 Interim Report, we refinanced and expanded our credit facility in April from EUR 500 million to EUR 650 million, consisting of a EUR 400 million revolver and EUR 250 million term loan. Following this refinancing, our team continued their disciplined capital allocation by using the proceeds to execute a EUR 138 million tender for our bonds maturing in 2024, taking advantage of large discounts and dislocation in secondary trading. In addition to the tender, we continued repurchasing bonds (EUR 15.7 million) in the open market at a significant discount during the second quarter and will continue to act opportunistically to repurchase debt. Through these actions, we continue to mitigate the earnings impact of higher current market interest rates, while also improving our overall balance sheet. In addition to the new credit facility and term loan, we have disposed of EUR 266 million of non-core assets at approx. book value over the past 20 months, including EUR 120 million in December 2022, which is part of our planned EUR 500 million asset sale target. With the additional flexibility of the new credit facility, we can be patient as Nordic transaction markets stabilize and we continue our asset management initiations to maximize values for further sales transactions. Given the reports of significant amounts of investment capital waiting to be invested, we remain confident that we will meet our previously disclosed divestment target by the end of 2024.
As mentioned, the tenant mix of Citycon’s assets, which consists of municipal and grocery tenants, anchored by public transportation with indexation linked leases, sets us apart from our peer group. This long-stated strategy has already demonstrated its strength and resilience throughout a variety of market conditions, which we continue to improve upon. The most recent example of our active asset management is Myyrmanni centre in Finland, where we have further improved the tenant mix to increase the share of necessity-based tenants by signing several new leases including a new Lidl grocer and a 7,300 sq.m. Prisma hypermarket resulting in groceries representing over 50% of the total GLA when reopening this fall. This is consistent with what we have achieved in many of our properties including Columbus (which we sold in 2021) and will continue to accomplish across the portfolio. These actions not only provide stability to revenue growth, it has the added benefit of improving the average credit profile of our tenant base. These asset management decisions remain aligned with, but separate from, the zoning work we are doing to achieve substantial additional building rights across the portfolio.
Our business is really not that complicated. We own quality real estate, provide the consumer the goods and services they require, and provide an environment that is convenient to access. When you layer in the dramatic impact of compounding rent growth, you have the recipe for success. The bottom line is that our business fundamentals are strong, and our assets continue to perform very well. There is a scarcity of the type of high-quality retail assets we own, we have a proven business model and all of the important metrics (sales, footfall, rents, occupancy, collections) continue to show sustained growth. For all these reasons we remain bullish on the prospects of the business moving forward.
FX impact on LTV, NRV and IFRS equity
|
Actual FX-rates Q2/2023 |
14.7.2023 FX-rates |
31.12.2022 FX-rates |
31.12.2021 FX-rates |
|
|
LTV (%) |
43.0 % |
42.6 % |
42.0 % |
41.1 % |
|
EPRA NRV per share |
10.71 |
10.93 |
11.29 |
11.60 |
|
Equity increase compared to Q2 actual (MEUR) |
– |
32.4 |
86.2 |
131.9 |
OUTLOOK FOR THE YEAR 2023 – reaffirmed with additional FX details
|
Outlook for 2023 with year-end 2022 FX rates |
Potential FY2023 negative FX impact |
||
|
Direct operating profit |
MEUR |
174–192 |
-10 |
|
EPRA Earnings per share (basic) |
EUR |
0.69–0.81 |
-0.08 |
|
Adjusted EPRA Earnings per share (basic) |
EUR |
0.51–0.63 |
-0.08 |
The outlook assumes that there are no major changes in macroeconomic factors and that there will not be another wave of COVID-19 with restrictions resulting in significant store closures and no major disruptions from the war in Ukraine. These estimates are based on the existing property portfolio as well as year-end 2022 estimates of inflation, EUR–SEK and EUR–NOK exchange rates, and interest rates.
Given exchange rates have recently been subject to extraordinary volatility, estimated FX impact for the full year 2023 is provided as an additional information for further transparency and clarification. Potential negative FX impact for FY2023 is based on the assumption that EUR–SEK and EUR–NOK exchange rates stay at the level of 14 July 2023.
AUDIOCAST
Citycon’s investor, analyst and press conference call and live audiocasting will be held on Wednesday, 19 July 2023 at 10 am EEST. The audiocast can be participated by calling in and following live at this website: https://citycon.videosync.fi/q2-2023
Questions for the management can be presented by phone. To ask questions, join the teleconference by registering on the following link: http://palvelu.flik.fi/teleconference/?id=10010528
After the registration you will be provided with phone numbers and a conference ID to access the conference. To ask a question, press *5 on your telephone keypad to enter the queue.
The audiocast will be recorded and it will be available afterwards on Citycon’s website.
CITYCON OYJ
For further information, please contact:
Bret McLeod
Chief Financial Officer
Tel. +46 73 326 8455
[email protected]
Sakari Järvelä
VP, Corporate Finance and Investor Relations
Telephone +358 50 387 8180
[email protected]
Citycon is a leading owner, manager and developer of mixed-use real estate featuring modern, necessity-based retail with residential, office and municipal service spaces that enhance the communities in which they operate. Citycon is committed to sustainable property management in the Nordic region with assets that total approximately EUR 4.2 billion. Our centres are located in urban hubs in the heart of vibrant communities with direct connections to public transport and anchored by grocery, healthcare and other services that cater to the everyday needs of customers.
Citycon has investment-grade credit rating from Standard & Poor’s (BBB-). Citycon’s shares are listed on Nasdaq Helsinki Ltd.
www.citycon.com
The following files are available for download:
|
Citycon_Half-yearly Report 2023 |
View original content:https://www.prnewswire.co.uk/news-releases/citycon-h12023-compounding-operational-growth-301880146.html

Fintech PR
HTX 2025 Outlook: Five Sectors to Look Forward to, and How Trump’s Policy Will Affect Crypto Industry
SINGAPORE, Jan. 10, 2025 /PRNewswire/ — The year 2024 marks a significant chapter in the history of the crypto industry, where we witnessed continuous breakthroughs in blockchain technology, surges in Bitcoin price, and a gradually more open regulatory environment, with cryptocurrencies gaining increasing recognition from the mainstream. As 2025 unfolds, HTX, the world’s leading digital asset exchange, has released its latest report, HTX 2024 Global Web3 Blockchain Ecosystem Review and 2025 Outlook, which provides forward-looking insights into the development prospects of the crypto industry.
Key Sectors for 2025
In the report, HTX highlighted five key sectors that showed encouraging progress last year, and will continue to closely monitor these areas in 2025.
Bitcoin Ecosystem
In 2024, Bitcoin’s market dominance kept increasing, solidifying its position as the core asset, with spot ETFs acting as liquidity channels, and U.S. listed companies such as MicroStrategy (MSTR) serving as the vehicles to absorb unlimited dollar liquidity.
As a result, it is increasingly essential to further develop Bitcoin’s ecosystem and enhance capital utilization efficiency. With strong support from macro markets and infrastructure support, a further surge in Bitcoin demand over the next two years is well-anticipated.
Infrastructure
Infrastructure remained a cornerstone in 2024’s crypto investments and funding. The synergy between capital and technology has driven the rapid development of Layer 1, Layer 2, and middleware projects, among others.
Layer 1 solutions, in particular, now represent the focal point of technical development and exploration within the crypto space, and it is expected to remain a priority for development resources and capital investment in the future.
Meme Coins
The Meme coin sector emerged as a hotspot in 2024, fostering community consensus while integrating with fields like DeFi and GameFi to create new use cases. As the crypto market environment grows increasingly favorable, more retail investors are expected to enter the market, positioning Meme projects as vital channels for capital inflows.
AI
In 2024, the intersection of Crypto and AI sector has been driving the exploration of several segmented fields, the hottest one of which is AI agents. In the future, AI agents will gradually become personal butlers and assistants for users, serving them with comprehensive capabilities. Over time, they may develop unique cultures and religions.
This deep integration of AI and encryption technology is a groundbreaking evolution that is unattainable within Web2 and cannot be achieved by Web3 relying solely on encryption technology.
TON Ecosystem
Attributable to Telegram’s hundreds of millions of users and robust technical support, the TON ecosystem achieved significant milestones in various fields, pioneering the monetization of Web2 social applications through crypto. Moving into 2025, it needs to explore and find new business models to improve user retention and identify its next growth curve.
Donald Trump Effect: Bitcoin Strategic Reserve Worth Anticipating
The report also discusses the potential impact of crypto-friendly policies that could arise after Donald Trump takes office. Two important bills, the FIT21 Act and the Bitcoin Strategic Reserve Act, are likely to pass more quickly thanks to him.
The FIT21 Act aims to create a clear legal framework for token issuance and trading by classifying tokens as digital assets or digital commodities, transferring the regulatory responsibilities of many blockchain projects from the SEC to the CFTC, and introducing a safe harbor mechanism. This would help standardize and promote the healthy growth of the entire industry.
The Bitcoin Strategic Reserve Act, aligning with Trump’s campaign promises, if passed, would mark Bitcoin’s transition from a niche asset to a nationally recognized reserve asset, greatly enhancing its legitimacy and recognition. It may also prompt other countries to adopt similar measures to further advance Bitcoin’s global recognition and application.
The Act was submitted to Congress for deliberation on August 4, 2024, and referred to the Senate Banking Committee for review. Trump is well-positioned to push this bill through. Meanwhile, several U.S. states have already proposed their own Bitcoin Strategic Reserve bills. By 2025, Bitcoin as a strategic reserve may become a reality.
Additionally, under Trump’s presidency, the SAB121 Act is likely to be repealed, allowing traditional financial institutions to hold cryptocurrencies on their balance sheets, further accelerating the institutionalization of crypto assets and contributing to the overall maturity of the crypto market. The SEC’s application criteria of the Howey Test may also be relaxed, increasing the likelihood of more spot crypto ETFs being approved and more public listings of crypto companies.
Meanwhile, the report also provides a comprehensive summary of 2024, looking back on the key events that had a major impact on the crypto industry while summing up what HTX had achieved over the last year.
To learn more, please visit: https://square.htx.com/htx-2024-global-web3-blockchain-ecosystem-review-and-2025-outlook/
About HTX
Founded in 2013, HTX has evolved from a virtual asset exchange into a comprehensive ecosystem of blockchain businesses that span digital asset trading, financial derivatives, research, investments, incubation, and other businesses.
As a world-leading gateway to Web3, we harbor global capabilities that enable us to provide users with safe and reliable services.
Our growth strategy – “Global Expansion, Thriving Ecosystem, Wealth Effect, Security & Compliance”, underpins our commitment to providing quality services and values to virtual asset enthusiasts worldwide.
Contact Details
Ruder Finn Asia
[email protected]
Company Website
https://www.htx.com
Photo – https://mma.prnewswire.com/media/2595311/image_838145_24282172.jpg
Logo – https://mma.prnewswire.com/media/2391903/image_ID__Logo.jpg
![]() View original content:https://www.prnewswire.co.uk/news-releases/htx-2025-outlook-five-sectors-to-look-forward-to-and-how-trumps-policy-will-affect-crypto-industry-302347870.html
View original content:https://www.prnewswire.co.uk/news-releases/htx-2025-outlook-five-sectors-to-look-forward-to-and-how-trumps-policy-will-affect-crypto-industry-302347870.html

BEIJING, Jan. 10, 2025 /PRNewswire/ — Professor JIN Zhao, Assistant Professor of Finance at Cheung Kong Graduate School of Business (CKGSB), was honored with the Brattle Group Prize – Distinguished Papers at the 2025 American Finance Association (AFA) Annual Meeting held in San Francisco on January 5, 2025. This prestigious award recognizes outstanding papers on corporate finance published in the Journal of Finance, one of the discipline’s most esteemed academic journals. Professor Jin is the first scholar affiliated with a Chinese institution to receive this award since its inception in 1999. This achievement underscores the exceptional research capabilities and global impact of CKGSB’s faculty.
Professor Jin’s award-winning paper, “Artificial Intelligence, Education, and Entrepreneurship,” co-authored with Professor Michael Gofman from The Hebrew University of Jerusalem, offers a novel perspective and rigorous methodology to examine the intricate connections between artificial intelligence (AI), education, entrepreneurship, and financing. The study highlights the negative impact of AI talent migration from academia to industry on education systems as well as the establishment and funding capabilities of entrepreneurial ventures. By addressing these challenges, the research provides valuable theoretical insights and policy recommendations to support the sustainable development of the global AI industry.
Professor Jin Zhao is an Assistant Professor of Finance at CKGSB. He joined CKGSB in 2020 after earning his PhD in Finance from the University of Rochester. His research, which focuses on entrepreneurship, artificial intelligence, and corporate finance, has been presented at prestigious institutions, such as Stanford University, and published in leading academic journals. His work has also garnered attention from prominent media outlets, including The New York Times and The Wall Street Journal.
About CKGSB
Established in Beijing in November 2002, CKGSB is China’s first privately-funded and research-driven business school. The school aims to cultivate transformative business leaders with a global vision, sense of social responsibility, innovative mindset, and ability to lead with empathy and compassion (https://english.ckgsb.edu.cn).
View original content:https://www.prnewswire.co.uk/news-releases/ckgsb-professor-jin-zhao-becomes-first-chinese-business-school-scholar-to-win-afa-award-302347868.html


PORT VILA, Vanuatu, Jan. 10, 2025 /PRNewswire/ — Vantage Markets, a leading multi-asset trading platform, is set to make a significant impact at the upcoming iFX EXPO Dubai 2025, scheduled for January 14-16 at the Dubai World Trade Centre. As an Elite Sponsor, Vantage is poised to showcase its latest innovations and commitment to empowering traders worldwide.
In a recent exclusive interview, Souhail Fadlallah, Business Development Manager at Vantage, shared insights into the company’s objectives for the expo and the value it aims to deliver to attendees.
Fadlallah emphasized Vantage’s dedication to providing traders with tools and resources designed to enhance their trading experience. Attendees visiting Vantage’s booth can expect to discover the latest advancements in trading platforms, including features aimed at streamlining user experiences and optimizing performance.
Beyond technology, Vantage is committed to offering advanced educational resources. Fadlallah highlighted the company’s suite of learning tools that provide traders with valuable insights and training materials to sharpen their skills and achieve success in the financial markets. Additionally, Vantage’s robust affiliate and partner programs are designed to drive mutual growth and success, reflecting the company’s dedication to creating value for its partners.
For Vantage, participation in iFX EXPO Dubai 2025 is about more than showcasing its offerings; it’s about building trust and fostering meaningful connections. Fadlallah stated, “We want attendees to leave iFX EXPO Dubai with the clear message that Vantage is more than just a trading platform. We’re a partner deeply committed to innovation, transparency, and the success of all our clients.”
Vantage invites all attendees to visit their booth at the iFX EXPO Dubai 2025 to explore their offerings and engage with their team of experts. The event promises to be a hub of innovation, insights, and empowerment in trading.
For more information about Vantage and their participation in iFX EXPO Dubai 2025, visit Vantage Markets.
About Vantage
Vantage Markets (or Vantage) is a multi-asset CFD broker offering clients access to a nimble and powerful service for trading Contracts for Difference (CFDs) products, including Forex, Commodities, Indices, Shares, ETFs, and Bonds.
With over 15 years of market experience, Vantage transcends the role of broker, providing a trusted trading ecosystem, an award-winning mobile trading app, and a user-friendly trading platform that empowers clients to seize trading opportunities. Download the Vantage App on App Store or Google Play.
trade smarter @vantage
RISK WARNING: CFD trading carries significant risks. You could lose more than your initial investment.
Photo – https://mma.prnewswire.com/media/2595278/Vantage_Showcase_Innovation_iFX_EXPO_Dubai_2025.jpg
Logo – https://mma.prnewswire.com/media/2506103/Vantage_15_Logo_Logo.jpg
![]() View original content:https://www.prnewswire.co.uk/news-releases/vantage-to-showcase-innovation-at-ifx-expo-dubai-2025-302347838.html
View original content:https://www.prnewswire.co.uk/news-releases/vantage-to-showcase-innovation-at-ifx-expo-dubai-2025-302347838.html


-
 Fintech PR7 days ago
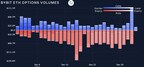
Bybit x Block Scholes Report: BTC Options Steady with Call-Put Parity, ETH Braces for Short-Term Volatility
-

 Fintech PR7 days ago
Artificial Intelligence (AI) in Trading Market to Reach USD 35 Billion by 2030, Growing at a 10% CAGR | Valuates Reports
-
 Fintech3 days ago
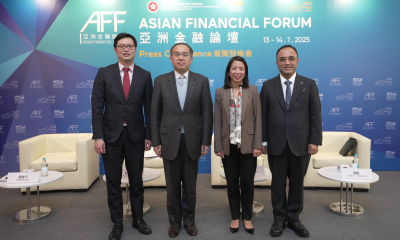
Asian Financial Forum held next week as the region’s first major international financial assembly of 2025
-

 Fintech PR3 days ago
OWIT Global Provides Alternative Delivery Models that Adapt to the Continuously Evolving Data Security Demands of the Industry
-

 Fintech PR4 days ago
Hyundai Motor Group Executive Chair Euisun Chung Outlines 2025 Vision Driven by Commitment to Innovation, Overcoming Challenges, and Creating Opportunities in New Year’s Message
-
 Fintech PR4 days ago
Zoomlion Accelerates Global Expansion with Localized Innovations in Saudi Arabia
-

 Fintech PR5 days ago
Payroll Service Market Anticipates Strong Growth Amid Rising Automation Demand
-

 Fintech PR1 day ago
Clear Channel Outdoor Holdings, Inc. to Sell its Europe-North Segment to a subsidiary of Bauer Media Group for $625 Million