

Fintech
TRU Reports High-Grade Gold Channel Sampling Results from Mark’s Pond Trench at Golden Rose Project, Including 57.6 g/t Au over 2.5 m, 34 g/t Au over 2 m & 23.5 g/t Au over 2 m
Toronto, Ontario–(Newsfile Corp. – January 12, 2023) – TRU Precious Metals Corp. (TSXV: TRU) (OTCQB: TRUIF) (“TRU” or the “Company”) is pleased to report high grade channel sampling results from a recent trenching program conducted on TRU’s claims under option from Quadro Resources Ltd. at TRU’s Golden Rose Project (“Golden Rose”) in Central Newfoundland (Figure 1). The channel sampling program was completed on the Mark’s Pond target located along the deposit-bearing Cape Ray-Valentine Lake Shear Zone, where the Company recently announced results of a grab sampling program that indicated high-grade gold potential (refer to TRU news release dated November 23, 2022).
TRU collected a total of 159 channel samples within the recently excavated 275 m long trench, including 85 samples within a 23 m long easterly extension at the southern end of the trench along strike of a visible gold-bearing volcaniclastic and graphitic shear zone. This newly discovered high-grade gold zone has been named the “Northcott Gold Zone” to recognize the significant discoveries made by prospector Ed Northcott in this area.
Highlights
-
The Northcott Gold Zone is a significant gold discovery for TRU within a newly uncovered brittle-ductile shear zone located 130 m northwest of the Mark’s Pond Gold Zone. This 2 to 3 m wide northeast trending shear zone contains abundant visible gold within quartz-carbonate veins and the surrounding wall rock.
-
Significant channel sample gold results from the Northcott Gold Zone include (Figure 2 and Table 1):
-
57.6 g/t Au over 2.5 m including 141 g/t Au over 1.0 m
-
34.0 g/t Au over 2.0 m including 65.4 g/t Au over 1.0 m
-
23.5 g/t Au over 2.0 m including 90 g/t Au over 0.5 m
-
-
Channel samples in the Northcott Gold Zone were collected at 0.5 to 1 m intervals within 14 transects along a 23 m long northeast strike-line. A full QAQC program was implemented, and the majority of the channel samples underwent total pulp metallics analysis due to fire assay results returning >1 g/t Au.
-
The Northcott Gold Zone remains open along strike to the southwest and northeast. TRU plans to extend the trench further in both directions and complete detailed structural mapping of the entire trench and additional channel sampling in spring 2023 prior to drilling this zone.
Paul Ténière, TRU’s Vice President – Exploration commented, “This is a very exciting time for TRU, and these excellent gold assay results from our recent channel sampling program help confirm our belief that the newly discovered Northcott Gold Zone is part of a larger scale, gold-endowed structural corridor located within the Mark’s Pond target area, and potentially extending to the Rich House target 4 km to the northeast. The Northcott Gold Zone is not far from the high-grade Mark’s Pond Gold Zone, and we anticipate further gold discoveries along strike and to the northwest. The Mark’s Pond – Rich House targets will be considered a high priority for our 2023 exploration program at Golden Rose including additional trenching, channel sampling, and drilling.“
Figure 2: Channel sampling assay results from Mark’s Pond trench
To view an enhanced version of Figure 2, please visit:
https://images.newsfilecorp.com/files/5993/151079_d4a06bb454ad1b56_002full.jpg
Table 1: Mark’s Pond channel sample assay composite summary
| Channel Sample Line | From (m) | To (m) | Width (m) | Au (g/t) |
| L-3W | 0.00 | 1.50 | 1.50 | 5.9 |
| Including | 1.00 | 1.50 | 0.50 | 10.1 |
| L-2W | 0.00 | 2.00 | 2.00 | 23.5 |
| Including | 1.00 | 1.50 | 0.50 | 90.0 |
| L-1W | 2.80 | 4.80 | 2.00 | 10.4 |
| Including | 2.80 | 3.30 | 0.50 | 37.1 |
| L-0 | 1.50 | 4.00 | 2.50 | 57.6 |
| Including | 2.00 | 3.00 | 1.00 | 141.0 |
| L-1E | 1.00 | 3.00 | 2.00 | 34.0 |
| Including | 1.00 | 2.00 | 1.00 | 65.4 |
| L-2E | 0.50 | 2.50 | 2.00 | 8.0 |
| Including | 1.00 | 1.50 | 0.50 | 29.4 |
| L-3E | 0.50 | 1.50 | 1.00 | 0.8 |
| L-4E | 1.00 | 1.50 | 0.50 | 5.4 |
| L-5E | 0.50 | 1.00 | 0.50 | 0.6 |
| L-6E | No Significant Values | |||
| L-7E | 1.00 | 1.50 | 0.50 | 11.1 |
| L-8E | 1.00 | 1.50 | 0.50 | 4.7 |
| L-9E | 0.50 | 2.00 | 1.50 | 17.8 |
| Including | 0.50 | 1.00 | 0.50 | 46.7 |
| L-10E | 0.00 | 0.50 | 0.50 | 2.0 |
Notes:
(1) Refer to Figure 2 for channel sample locations.
(2) Assay composite results incorporate both fire assay and metallic screening analysis results.
(3) Numbers have been rounded.
(4) True width of Northcott Gold Zone is currently unknown.
Technical Summary
The trench at Mark’s Pond is located approximately 130 m northwest of the historically drilled Mark’s Pond Gold Zone. During TRU’s fall exploration program, this historical trench was re-opened and extended to the north to test a second, multiple line, east-west trending historical gold-in soil anomaly that had not been previously trenched or drilled. A high-resolution drone (UAV) imagery survey was completed by Insite Surveys of Burgeo, NL over the entire trench also capturing the channel sampling locations in precise detail. The drone imagery has been georeferenced for structural mapping purposes and to precisely locate the channel samples for geological modelling purposes (Figure 2).
The channel sampling program included the insertion of QAQC materials (certified reference materials, blanks, and field duplicates) at regular intervals by TRU geologists, and the samples were sent to Eastern Analytical Ltd. (“Eastern Analytical”) in Springdale, NL for fire assay and ICP multi-element geochemistry analyses. Any channel samples returning a fire assay result greater than 1 g/t Au triggered a total pulp metallics analysis (metallic screening) of the sample to mitigate the presence of the nugget effect of coarse gold and to better characterize the coarse- and fine-grained gold fractions within these prominent gold bearing units. Complete fire assay and metallic screen analysis results for the channel samples collected in the Northcott Gold Zone are shown in Table 2. True width of the Northcott Gold Zone is unknown at this time. However, the rock units are subvertical indicating sampled widths are likely close to true width and this will be confirmed in future drilling programs.
The channel sample assay results indicate that the structurally-complex graphitic zone with stockwork quartz-carbonate veins containing visible gold within the Northcott Gold Zone tends to pinch and swell along strike, with high-grade widths ranging between <1 to 2.5 m (Figure 2). Associated wall-rock alteration includes carbonatization and sericitization typical within orogenic gold deposits with steeply dipping brittle-ductile shear zones hosting native gold.
A total of 74 channel samples were collected at several exposed bedrock locations along the rest of the trench, northwest of the Northcott Gold Zone, but returned no significant gold assay values. However, field crews were unable to complete channel sampling of the entire length of the trench due to the rapid onset of winter conditions. In spring 2023, TRU plans to channel sample all remaining low-lying (ponded) areas within the trench that may contain gold similar to that discovered in the southeastern part of the trench.
As noted earlier, gold mineralization remains open to the southwest and northeast of the current trench limit. TRU plans to extend the southern part of the trench in both directions in spring and summer 2023 and complete channel sampling within these extensions and to the northwest in areas of the trench that remain unsampled. In addition, a detailed structural mapping program will be undertaken in the trench to characterize the veins, collect structural measurements, and understand any structural controls on gold mineralization in the Mark’s Pond target area.
Sampling, QAQC, and Analytical Procedures
All channel samples were cut using portable saws with diamond blades and cleaned thoroughly with fresh water prior to insertion into sample bags by TRU field staff. This trench and sample cleaning process was implemented to eliminate the possibility of sample contamination by overburden (soil and till). The exact location of the channel sample line was taken using a handheld GPS unit and indicated on a hand drawn trench map, and field notes were taken on lithology, structure, and mineralization. The exact locations of the channel samples were later correlated and georeferenced with the high precision drone survey imagery. The channel samples were securely transported by TRU field staff to Eastern Analytical, a commercial laboratory that is ISO/IEC 17025 accredited and independent of TRU. Eastern Analytical pulverized 1,000 grams of each sample to 95% < 89 μm. Samples are analyzed using fire assay (30g) with AA finish and an ICP-34, four acid digestion followed by ICP-OES analysis. All samples with visible gold or assaying above 1.00 g/t Au were further assayed using total pulp metallic analysis (metallic screening) to mitigate the presence of the nugget effect of coarse gold.
Eastern Analytical total pulp metallic sieve procedure: Crush entire sample to approximately 80% (-10 mesh). Total sample is pulverized to approximately 95% (-150 mesh) in 200-300g portions. Sieve all pulverized material through 150 mesh screen. The total (+150 mesh) fraction is all fire assayed as one sample and the weight recorded. The entire (-150 mesh) fraction is rolled to homogenize and stored in a plastic bag. The entire weight of the (-150 mesh) fraction is recorded. A 30g sample is fire assayed from the (-150 mesh) portion. The two fire assay results (+150 and -150 mesh) are calculated (with the total weight of the sample to provide a weighted average of the sample) and the weighted average Au result is reported.
The TRU exploration programs are designed to be consistent with mining industry best practices and the programs are supervised by Qualified Persons employing a full QAQC program consistent with requirements under the CIM Mineral Exploration Best Practice Guidelines (2018) and National Instrument 43-101 (“NI 43-101”).
Table 2: Complete fire assay and metallic screening analysis results for the Northcott Gold Zone
| Sample ID |
Width (m) | Channel Line | Au (ppb) |
+150 Mesh wt (g) | Au (ppb) | -150 Mesh wt (g) | Total wt (g) | Weighted Average (ppb) |
Au (g/t) |
| D00380329 | 1.0 | L-3W | 56,867 | 25.68 | 3,700 | 10,733.32 | 10,759 | 3,826.90 | 3.83 |
| D00380330 | 0.5 | L-3W | 3,197,272 | 1.21 | 8,773 | 2,902.79 | 2,904 | 10,101.54 | 10.10 |
| D00380331 | 1.0 | L-2W | 12,433 | 25.61 | 661 | 6,911.39 | 6,937 | 704.46 | 0.70 |
| D00380332 | 0.5 | L-2W | 1,556,247 | 41.29 | 74,059 | 3,792.71 | 3,834 | 90,021.32 | 90.02 |
| D00380333 | 0.5 | L-2W | 34,126 | 71.38 | 3,347 | 4,015.62 | 4,087 | 3,884.56 | 3.88 |
| D00380326 | 0.5 | L-1W | 185,648 | 67.12 | 34,092 | 3,371.88 | 3,439 | 37,050.00 | 37.05 |
| D00380327 | 1.0 | L-1W | 26,879 | 49.90 | 1,608 | 4,921.10 | 4,971 | 1,862.00 | 1.86 |
| D00380328 | 0.5 | L-1W | 0.90 | ||||||
| D00380337 | 0.5 | L-0 | 34,225 | 51.41 | 4,954 | 3,453.59 | 3,505 | 5,383.34 | 5.38 |
| D00380338 | 1.0 | L-0 | 3,317,524 | 66.04 | 92,604 | 4,335.96 | 4,402 | 140,985.13 | 140.99 |
| D00380339 | 0.5 | L-0 | 0.03 | ||||||
| D00380340 | 0.5 | L-0 | 0.50 | ||||||
| D00380349 | 0.5 | L-1E | 863,588 | 66.65 | 52,918 | 4,319.35 | 4,386 | 65,237.00 | 65.24 |
| D00380350 | 0.5 | L-1E | 1,852,542 | 24.00 | 56,390 | 4,647.00 | 4,671 | 65,618.78 | 65.62 |
| D00380351 | 0.5 | L-1E | 0.50 | ||||||
| D00380352 | 0.5 | L-1E | 174,207 | 19.23 | 3,864 | 5,104.77 | 5,124 | 4,503.28 | 4.50 |
| D00380358 | 0.5 | L-2E | 0.90 | ||||||
| D00380359 | 0.5 | L-2E | 104,777 | 26.47 | 28,845 | 3,543.53 | 3,570 | 29,408.00 | 29.41 |
| D00380360 | 0.5 | L-2E | 0.02 | ||||||
| D00380361 | 0.5 | L-2E | 5,759 | 31.22 | 1,456 | 4,171.78 | 4,203 | 1,487.96 | 1.49 |
| D00380366 | 0.5 | L-3E | 0.50 | ||||||
| D00380367 | 0.5 | L-3E | 1,013 | 20.86 | 1,180 | 3,826.14 | 3,847 | 1,179.09 | 1.18 |
| D00380372 | 0.5 | L-4E | 37,737 | 10.07 | 5,302 | 2,628.93 | 2,639 | 5,425.77 | 5.43 |
| D00380379 | 0.5 | L-5E | 0.60 | ||||||
| D00380384 | 1.0 | L-6E | 0.02 | ||||||
| D00380391 | 0.5 | L-7E | 30,029 | 25.48 | 11,047 | 6,166.52 | 6,192 | 11,125.11 | 11.13 |
| D00380395 | 0.5 | L-8E | 1,786 | 68.87 | 4,783 | 1,993.13 | 2,062 | 4,682.90 | 4.68 |
| D00380401 | 0.5 | L-9E | 973,054 | 28.39 | 41,505 | 5,091.61 | 5,120 | 46,670.37 | 46.67 |
| D00380402 | 0.5 | L-9E | 42,360 | 34.65 | 3,719 | 4,082.35 | 4,117 | 4,044.22 | 4.04 |
| D00380403 | 0.5 | L-9E | 12,639 | 39.58 | 2,514 | 3,479.42 | 3,519 | 2,627.88 | 2.63 |
Note: Both fire assay and metallic screening analysis results are shown. True widths unknown at this time.
Cautionary Statements
Readers are cautioned that descriptions of mineralization and the channel sample assay results reported in this news release are preliminary and/or early-stage results. While these results are considered encouraging, there is no guarantee that they indicate significant mineralization will be intersected in future drilling programs completed by the Company.
Qualified Person Statement and Data Verification
The scientific and technical information disclosed in this news release has been prepared and approved by Paul Ténière, M.Sc., P.Geo., Vice President of Exploration for TRU, and a Qualified Person as defined in NI 43-101.
Mr. Ténière has verified all scientific and technical data disclosed in this news release including the channel sampling and QAQC results, and certified analytical data underlying the technical information disclosed. Mr. Ténière noted no errors or omissions during the data verification process and TRU’s Exploration Manager has also verified the information disclosed. The Company and Mr. Ténière do not recognize any factors of sampling or recovery that could materially affect the accuracy or reliability of the assay data disclosed in this news release.
About TRU Precious Metals Corp.
TRU (TSXV: TRU) (OTCQB: TRUIF) is on a mission to build long-term shareholder value, through prudent natural resource property development and transactions. TRU is exploring for gold and copper in the highly prospective Central Newfoundland Gold Belt on its 100%-owned Golden Rose Project, originally optioned from TSX-listed Altius Minerals. Golden Rose is a regional-scale 236 km2 land package, including a recently discovered 20 km district-scale structure, and an additional 45 km of strike length along the deposit-bearing Cape Ray – Valentine Lake Shear Zone, directly between Marathon Gold’s Valentine Gold Project and Matador Mining’s Cape Ray Gold Project. In addition, TRU has an option to acquire up to an aggregate 65% ownership interest in two claim packages covering 33.25 km2 including a 12 km strike length along the Shear Zone within Golden Rose.
TRU is a portfolio company of Resurgent Capital Corp. (“Resurgent”), a merchant bank providing venture capital markets advisory services and proprietary financing. Resurgent works with promising public and pre-public micro-capitalization companies listing on Canadian stock exchanges. For more information on Resurgent and its portfolio companies, please visit Resurgent’s website at https://www.resurgentcapital.ca/ or follow Resurgent on LinkedIn at https://ca.linkedin.com/company/resurgent-capital-corp.
For further information about TRU, please contact:
Joel Freudman
Co-Founder & CEO
TRU Precious Metals Corp.
Phone: 1-855-760-2TRU (2878)
Email: [email protected]
To connect with TRU via social media, below are links:
Twitter: https://twitter.com/corp_tru
LinkedIn: https://www.linkedin.com/company/tru-precious-metals-corp
YouTube: https://www.youtube.com/channel/UCHghHMDQaYgS1rDHiZIeLUg/
Neither TSX Venture Exchange nor its Regulation Services Provider (as that term is defined in policies of the TSX Venture Exchange) accepts responsibility for the adequacy or accuracy of this release.
Acknowledgement
TRU would like to thank the Government of Newfoundland and Labrador for its past financial support through the Junior Exploration Assistance Program.
Forward-Looking Statements
This press release contains certain forward-looking statements, including those relating to exploration plans and mineralization potential at Golden Rose. These statements are based on numerous assumptions regarding Golden Rose and the Company’s drilling and exploration programs and results that are believed by management to be reasonable in the circumstances, and are subject to a number of risks and uncertainties, including without limitation: mineralization hosted on adjacent and/or nearby properties is not necessarily indicative of mineralization hosted on Golden Rose; the exploration potential of Golden Rose and the nature and style of mineralization at Golden Rose; risks inherent in mineral exploration activities; volatility in precious metals prices; and those other risks described in the Company’s continuous disclosure documents. Actual results may differ materially from results contemplated by the forward-looking statements herein. Investors and others should carefully consider the foregoing factors and should not place undue reliance on such forward-looking statements. The Company does not undertake to update any forward-looking statements herein except as required by applicable securities laws.
To view the source version of this press release, please visit https://www.newsfilecorp.com/release/151079

Modern brands stake on influencer marketing, with 76% of users making a purchase after seeing a product on social media.The cryptocurrency industry is no exception to this trend. However, promoting crypto products through influencer marketing can be particularly challenging. Crypto influencers pose a significant risk to a brand’s reputation and ROI due to rampant scams. Approximately 80% of channels provide fake statistics, including followers counts and engagement metrics. Additionally, this niche is characterized by high CPMs, which can increase the risk of financial loss for brands.
In this article Nadia Bubennnikova, Head of agency Famesters, will explore the most important things to look for in crypto channels to find the perfect match for influencer marketing collaborations.
-
Comments
There are several levels related to this point.
LEVEL 1
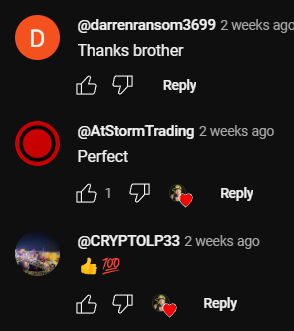
Analyze approximately 10 of the channel’s latest videos, looking through the comments to ensure they are not purchased from dubious sources. For example, such comments as “Yes sir, great video!”; “Thanks!”; “Love you man!”; “Quality content”, and others most certainly are bot-generated and should be avoided.
Just to compare:
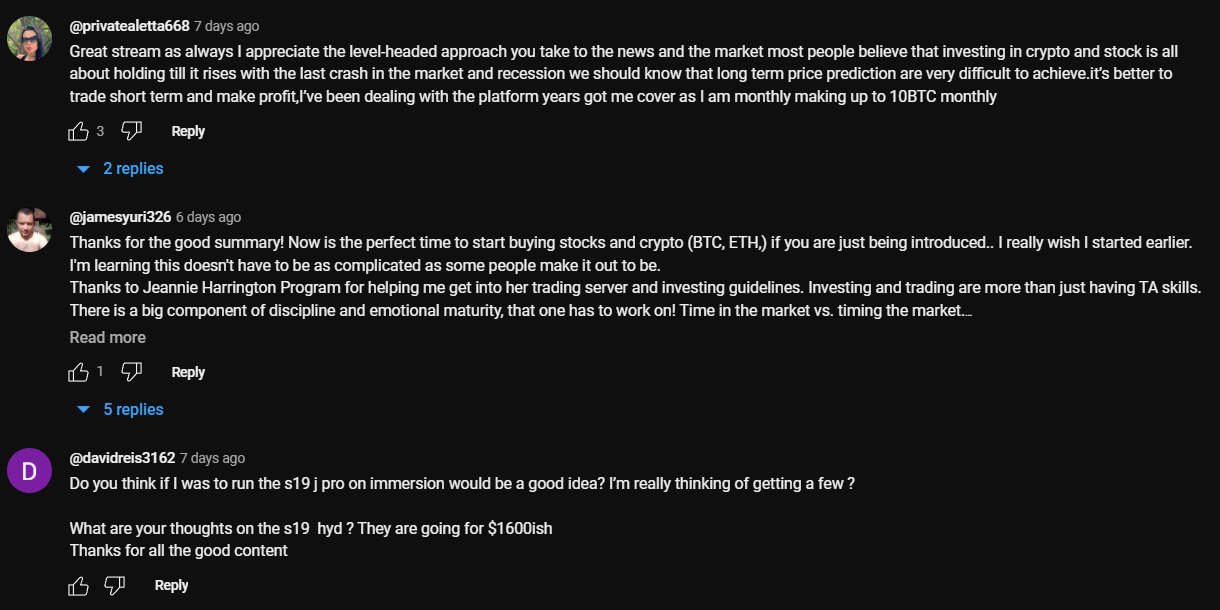
LEVEL 2
Don’t rush to conclude that you’ve discovered the perfect crypto channel just because you’ve come across some logical comments that align with the video’s topic. This may seem controversial, but it’s important to dive deeper. When you encounter a channel with logical comments, ensure that they are unique and not duplicated under the description box. Some creators are smarter than just buying comments from the first link that Google shows you when you search “buy YouTube comments”. They generate topics, provide multiple examples, or upload lists of examples, all produced by AI. You can either manually review the comments or use a script to parse all the YouTube comments into an Excel file. Then, add a formula to highlight any duplicates.
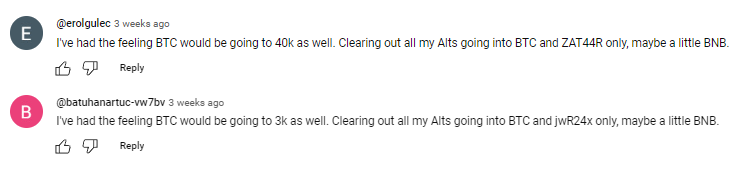
LEVEL 3
It is also a must to check the names of the profiles that leave the comments: most of the bot-generated comments are easy to track: they will all have the usernames made of random symbols and numbers, random first and last name combinations, “Habibi”, etc. No profile pictures on all comments is also a red flag.
LEVEL 4
Another important factor to consider when assessing comment authenticity is the posting date. If all the comments were posted on the same day, it’s likely that the traffic was purchased.
2. Average views number per video
This is indeed one of the key metrics to consider when selecting an influencer for collaboration, regardless of the product type. What specific factors should we focus on?
First & foremost: the views dynamics on the channel. The most desirable type of YouTube channel in terms of views is one that maintains stable viewership across all of its videos. This stability serves as proof of an active and loyal audience genuinely interested in the creator’s content, unlike channels where views vary significantly from one video to another.
Many unauthentic crypto channels not only buy YouTube comments but also invest in increasing video views to create the impression of stability. So, what exactly should we look at in terms of views? Firstly, calculate the average number of views based on the ten latest videos. Then, compare this figure to the views of the most recent videos posted within the past week. If you notice that these new videos have nearly the same number of views as those posted a month or two ago, it’s a clear red flag. Typically, a YouTube channel experiences lower views on new videos, with the number increasing organically each day as the audience engages with the content. If you see a video posted just three days ago already garnering 30k views, matching the total views of older videos, it’s a sign of fraudulent traffic purchased to create the illusion of view stability.
3. Influencer’s channel statistics
The primary statistics of interest are region and demographic split, and sometimes the device types of the viewers.
LEVEL 1
When reviewing the shared statistics, the first step is to request a video screencast instead of a simple screenshot. This is because it takes more time to organically edit a video than a screenshot, making it harder to manipulate the statistics. If the creator refuses, step two (if only screenshots are provided) is to download them and check the file’s properties on your computer. Look for details such as whether it was created with Adobe Photoshop or the color profile, typically Adobe RGB, to determine if the screenshot has been edited.
LEVEL 2
After confirming the authenticity of the stats screenshot, it’s crucial to analyze the data. For instance, if you’re examining a channel conducted in Spanish with all videos filmed in the same language, it would raise concerns to find a significant audience from countries like India or Turkey. This discrepancy, where the audience doesn’t align with regions known for speaking the language, is a red flag.
If we’re considering an English-language crypto channel, it typically suggests an international audience, as English’s global use for quality educational content on niche topics like crypto. However, certain considerations apply. For instance, if an English-speaking channel shows a significant percentage of Polish viewers (15% to 30%) without any mention of the Polish language, it could indicate fake followers and views. However, if the channel’s creator is Polish, occasionally posts videos in Polish alongside English, and receives Polish comments, it’s important not to rush to conclusions.
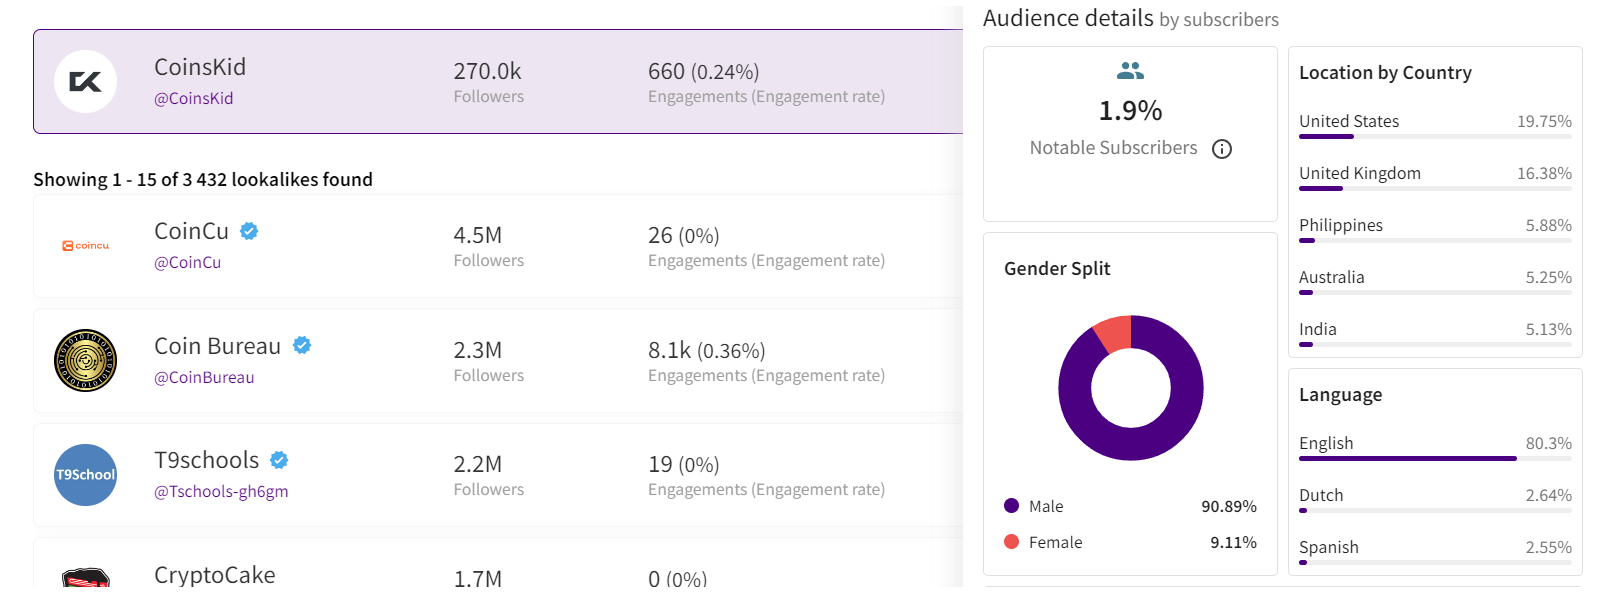 Example of statistics
Wrapping up
These are the main factors to consider when selecting an influencer to promote your crypto product. Once you’ve launched the campaign, there are also some markers to show which creators did bring the authentic traffic and which used some tools to create the illusion of an active and engaged audience. While this may seem obvious, it’s still worth mentioning. After the video is posted, allow 5-7 days for it to accumulate a basic number of views, then check performance metrics such as views, clicks, click-through rate (CTR), signups, and conversion rate (CR) from clicks to signups.
If you overlooked some red flags when selecting crypto channels for your launch, you might find the following outcomes: channels with high views numbers and high CTRs, demonstrating the real interest of the audience, yet with remarkably low conversion rates. In the worst-case scenario, you might witness thousands of clicks resulting in zero to just a few signups. While this might suggest technical issues in other industries, in crypto campaigns it indicates that the creator engaged in the campaign not only bought fake views and comments but also link clicks. And this happens more often than you may realize.
Summing up, choosing the right crypto creator to promote your product is indeed a tricky job that requires a lot of resources to be put into the search process.

Author
Nadia Bubennikova, Head of agency at Famesters
The BIS, along with seven leading central banks and a cohort of private financial firms, has embarked on an ambitious venture known as Project Agorá.
Named after the Greek word for “marketplace,” this initiative stands at the forefront of exploring the potential of tokenisation to significantly enhance the operational efficiency of the monetary system worldwide.
Central to this pioneering project are the Bank of France (on behalf of the Eurosystem), the Bank of Japan, the Bank of Korea, the Bank of Mexico, the Swiss National Bank, the Bank of England, and the Federal Reserve Bank of New York. These institutions have joined forces under the banner of Project Agorá, in partnership with an extensive assembly of private financial entities convened by the Institute of International Finance (IIF).
At the heart of Project Agorá is the pursuit of integrating tokenised commercial bank deposits with tokenised wholesale central bank money within a unified, public-private programmable financial platform. By harnessing the advanced capabilities of smart contracts and programmability, the project aspires to unlock new transactional possibilities that were previously infeasible or impractical, thereby fostering novel opportunities that could benefit businesses and consumers alike.
The collaborative effort seeks to address and surmount a variety of structural inefficiencies that currently plague cross-border payments. These challenges include disparate legal, regulatory, and technical standards; varying operating hours and time zones; and the heightened complexity associated with conducting financial integrity checks (such as anti-money laundering and customer verification procedures), which are often redundantly executed across multiple stages of a single transaction due to the involvement of several intermediaries.
As a beacon of experimental and exploratory projects, the BIS Innovation Hub is committed to delivering public goods to the global central banking community through initiatives like Project Agorá. In line with this mission, the BIS will soon issue a call for expressions of interest from private financial institutions eager to contribute to this ground-breaking project. The IIF will facilitate the involvement of private sector participants, extending an invitation to regulated financial institutions representing each of the seven aforementioned currencies to partake in this transformative endeavour.
Source: fintech.globa
The post Central banks and the FinTech sector unite to change global payments space appeared first on HIPTHER Alerts.
TD Bank has inked a multi-year deal with Google Cloud as it looks to streamline the development and deployment of new products and services.
The deal will see the Canadian banking group integrate the vendor’s cloud services into a wider portion of its technology solutions portfolio, a move which TD expects will enable it “to respond quickly to changing customer expectations by rolling out new features, updates, or entirely new financial products at an accelerated pace”.
This marks an expansion of the already established relationship between TD Bank and Google Cloud after the group previously adopted the vendor’s Google Kubernetes Engine (GKE) for TD Securities Automated Trading (TDSAT), the Chicago-based subsidiary of its investment banking unit, TD Securities.
TDSAT uses GKE for process automation and quantitative modelling across fixed income markets, resulting in the development of a “data-driven research platform” capable of processing large research workloads in trading.
Dan Bosman, SVP and CIO of TD Securities, claims the infrastructure has so far supported TDSAT with “compute-intensive quantitative analysis” while expanding the subsidiary’s “trading volumes and portfolio size”.
TD’s new partnership with Google Cloud will see the group attempt to replicate the same level of success across its entire portfolio.
Source: fintechfutures.com
The post TD Bank inks multi-year strategic partnership with Google Cloud appeared first on HIPTHER Alerts.


-
Latest News6 days ago
“The Hainan FTP and Me”: Looking at Hainan’s Transformations
-
Latest News5 days ago
Millions of people unite around doing good on the 18th International Good Deeds Day held yesterday worldwide
-
Latest News4 days ago
Banxso Acquires Australian ASIC License, Enhancing Its Global Trading Operations
-
Latest News3 days ago
BMO Announces Election of Board of Directors
-
Latest News5 days ago
135th Canton Fair Launches a Showcase of Innovative Products of New Collection to Lead Global Market Trends
-
Latest News5 days ago
BII and FMO back BECIS with joint US$50 million financing facility supporting commercial and industrial renewables sector in South-East Asia
-
Latest News4 days ago
IHG Hotels & Resorts and NOVUM Hospitality sign agreement that doubles IHG’s hotel presence in Germany, launches Holiday Inn – the niu collaboration, and debuts Garner and Candlewood Suites brands
-
Latest News4 days ago
Former PayPal chief Dan Schulman joins Valor Capital as managing partner