

Fintech
Opera reports fourth quarter and full-year 2021 Results

Opera Limited (NASDAQ: OPRA), one of the world’s largest internet consumer brands with hundreds of millions of users worldwide, today announced its unaudited consolidated financial results for the quarter ended December 31, 2021.
Fourth quarter and full year 2021 financial highlights
|
Three Months Ended December 31, |
Year-over- |
Twelve Months Ended December 31, |
Year-over- |
|||||||||||||||||||||
|
[US$ thousands, except for margins and per ADS amounts] |
2020 |
2021 |
year % |
2020 |
2021 |
year % |
||||||||||||||||||
|
Revenue |
50,229 |
72,626 |
44.6 |
% |
165,056 |
250,991 |
52.1 |
% |
||||||||||||||||
|
Net income (loss) |
28,527 |
(84,209) |
-395.2 |
% |
179,174 |
(15,784) |
-108.8 |
% |
||||||||||||||||
|
Margin |
56.8 |
% |
-115.9 |
% |
108.6 |
% |
-6.3 |
% |
||||||||||||||||
|
Adjusted EBITDA (1) |
14,052 |
16,091 |
14.5 |
% |
24,969 |
27,850 |
11.5 |
% |
||||||||||||||||
|
Margin |
28.0 |
% |
22.2 |
% |
15.1 |
% |
11.1 |
% |
||||||||||||||||
|
Adjusted net income (loss) (1) |
45,298 |
(77,906) |
-272.0 |
% |
62,876 |
5,661 |
-91.0 |
% |
||||||||||||||||
|
Margin |
90.2 |
% |
-107.3 |
% |
38.1 |
% |
2.3 |
% |
||||||||||||||||
|
Diluted net income (loss) per ADS, US$ |
0.25 |
(0.73) |
-395.5 |
% |
1.51 |
(0.14) |
-109.0 |
% |
||||||||||||||||
|
Diluted adjusted net income (loss) per ADS, US$ (1) |
0.38 |
(0.68) |
-279.1 |
% |
0.53 |
0.05 |
-90.8 |
% |
||||||||||||||||
|
(1) Please see the separate section “About non-IFRS financial measures” for the definitions of adjusted EBITDA and adjusted net income. |
|
“We’re very excited that both revenue and adjusted EBITDA came in ahead of expectations, closing out a very strong 2021”, said Co-CEO Song Lin. “Looking back, we can conclude that our investments in marketing to accelerate our growth trajectory and strengthen our position in higher-ARPU markets, and investments in our strong and growing product portfolio, have paid off.”
“Even more encouragingly, as we look ahead, we have every expectation that we will continue a healthy growth trajectory from this elevated scale, with margins continuing to normalize.”
Fourth Quarter and Recent Business Highlights
- Core search and advertising revenue growth rates grew 47% year-over-year in the fourth quarter, driven by strong browser and news performance.
- Opera’s average monthly active user base was 344 million MAUs in the quarter; with a continued directional shift towards higher ARPU markets. User growth was the strongest in the Americas, this time led by Latin America up 35% and North America up 22%, while we continue to focus investments in emerging markets more specifically towards users that are monetizable.
- In the fourth quarter, each user on average generated a record 83 cents of revenue on an annualized basis, up 11% sequentially, and up 62% compared to the fourth quarter of 2020.
- The Opera GX gaming browser had over 14 million monthly active users across PC and mobile during the fourth quarter.
- The beta version of the Opera Web 3.0 browser was released as the newest addition to our family of browsers.
- Our equity-accounted investee Nanobank has experienced a prolonged period of inability to operate in India, and as a result we have impaired all assets and intangible values related to its Indian subsidiary, totaling $82.6 million and resulting in a negative net income for the year.
- Opera announced a $50 million stock buyback program that is in effect for the next two years.
Business Outlook
“We are very pleased that the strategy we have embarked on is already paying off,” said CFO Frode Jacobsen. “It is encouraging that our margins normalized faster than anticipated as our investments in the business have resulted in revenue growth ahead of plan.”
For the first quarter of 2022, Opera expects revenue of $67 million to $70 million, representing 33% year-over-year growth at the midpoint and reflecting normal seasonality, while benefiting from the additional scale we built throughout 2021. Adjusted EBITDA is expected to be between $4 million and $7 million.
For the full year of 2022, Opera expects revenue of $300 million to $310 million, representing a 22% year-over-year increase at the midpoint. We expect adjusted EBITDA to be between $50 million and $60 million, or an 18% margin at the midpoint, versus 11% for 2021. Our 2022 results are expected to benefit from the continued growth of our products in Western markets as well as the continuation of underlying ARPU improvements across all of our regions.
Other updates
Opera holds valuable investments in OPay (6.44%), StarMaker (19.35%), and Nanobank (42.35%).
Nanobank, our equity-accounted investee which provides microlending services in several emerging markets, saw record activity in all of its active markets except for India. As we noted in our third quarter report, Nanobank’s Indian subsidiary became subject to inspection by the Ministry of Finance of India and now by its regulator, with particular focus on the fees paid for use of technology and platform infrastructure that is developed centrally by Nanobank for use across all of its operating markets. That process has taken months, and is still ongoing. Pending a resolution, a substantial portion of the funds of Nanobank’s Indian subsidiary have been subject to seizure, effectively halting its entire Indian operation. As a consequence of the prolonged situation and lack of clarity, Nanobank has recognized material provisions and impairments in the fourth quarter to bring the book value of its Indian subsidiary to zero; consequently we have impaired our investment in Nanobank to reflect the circumstances. That led to substantial non-cash losses in the quarter, partially offsetting the accounting gain associated with the creation of Nanobank in the third quarter of 2020. While we are taking an appropriate approach in our financial statements, Nanobank remains highly engaged to facilitate a return of operations.
Fourth quarter 2021 consolidated financial results
All comparisons in this section are relative to the fourth quarter of 2020 unless otherwise stated.
Revenue increased 45% to $72.6 million in the quarter.
- Search revenue increased by 35% to $34.8 million driven by both PC and mobile browser monetization growth.
- Advertising revenue increased by 59% to $36.7 million, predominantly fueled by monetization growth within Opera News, our ad tech platform and our mobile browsers.
- Technology licensing and other revenue was $1.2 million.
Operating expenses increased by 31% to $70.6 million.
- Combined technology and platform fees, content cost and cost of inventory sold was $5.5 million, a 150% increase following the scaling of associated revenues.
- Personnel expenses, including share-based remuneration, were $18.0 million, a 13% increase. This expense consists of cash-based compensation expense of $14.9 million, nearly flat year-over-year, and $3.1 million of share-based remuneration expense.
- Marketing and distribution expenses were $30.3 million, an increase of $18.0 million or 146% versus the fourth quarter of 2020, while representing a slight decline compared to the immediate prior quarters.
- Depreciation and amortization expenses were $4.6 million, a 22% decrease as relevant asset bases declined over time.
- Impairment of non financial assets of $6.4 million were mainly related to our decision to close our fintech office in Tallinn.
- Other operating expenses were $5.7 million, a 16% decrease predominantly driven by reductions in credit loss expenses and professional services.
Operating profit was $2.2 million compared to an operating profit of $2.4 million in the fourth quarter of 2020.
Other items in the quarter include a total impairment of $82.6 million related to the Indian subsidiary of Nanobank. $62.1 million of this amount is recorded in a new line item called impairment of associates and joint ventures and the remaining $20.5 million is included as the main component in our share of net loss of associates and joint ventures.
Income tax expense was $2.4 million in the quarter.
Net loss was $84.2 million. This compared to a net income of $28.5 million in the fourth quarter of 2020.
Net loss per ADS was $0.73 in the quarter. Each ADS represents two shares in Opera Limited. In the quarter, the average number of shares outstanding was 230.3 million, corresponding to 115.1 million ADSs.
Adjusted EBITDA was $16.1 million, representing a 22% adjusted EBITDA margin, compared to adjusted EBITDA of $14.1 million in the fourth quarter of 2020. Adjusted EBITDA excludes share-based remuneration and non-recurring expenses, as well as other income and discontinued operations.
Adjusted net loss was $77.9 million in the quarter, compared to adjusted net income of $45.3 million in the fourth quarter of 2020. Adjusted net income excludes share-based remuneration, non-recurring expenses, discontinued operations and amortization of intangible assets related to acquisitions.
Adjusted net loss per ADS was $0.67 in the quarter.
We have posted unaudited supplemental information at https://investor.opera.com, including: 1) Opera’s financial historical results by quarter since 2019; and 2) Nanobank financial results by quarter since 2019 (pro forma prior to August 19, 2020).
Conference call
Opera’s management will host a conference call to discuss the fourth quarter 2021 financial results on Thursday, February 17th at 8:00 am Eastern Time (EST) (2:00 PM Central European Time, 9:00 PM Beijing/Hong Kong time). Listeners may access the call by dialing the following numbers:
United States: +1 877-895-3361
China: +10-800-714-1507 or +10-800-140-1382
Hong Kong: +80-090-1494
Norway: +47 80-01-3780
United Kingdom: +44 (0) 808-101-1183
International: +1 785-424-1062
Confirmation Code: OPRAQ421
A live webcast of the conference call will be posted at https://investor.opera.com.
We will be tweeting highlights from our prepared remarks. Please follow along @InvestorOpera.
About non-IFRS financial measures
To supplement our consolidated financial statements, which are prepared and presented based on IFRS, we use adjusted EBITDA and adjusted net income, both non-IFRS financial measures, to understand and evaluate our core operating performance. These non-IFRS financial measures, which may differ from similarly titled measures used by other companies, are presented to enhance investors’ overall understanding of our financial performance and should not be considered a substitute for, or superior to, the financial information prepared and presented in accordance with IFRS.
We define adjusted EBITDA as net income (loss) excluding income tax expense (benefit), net finance expense (income), share of net loss (income) of associates and joint ventures, other loss (income) from long-term investments, impairments, depreciation and amortization, share-based remuneration, non-recurring expenses, and excluding other income and profit (loss) from discontinued operations.
We define adjusted net income as net income (loss) excluding share-based remuneration, amortization cost related to acquired intangible assets, amortization of Nanobank intangible assets, non-recurring expenses, and excluding profit (loss) from discontinued operations, adjusted for the associated tax benefit related to such items.
We believe that adjusted EBITDA and adjusted net income provide useful information to investors and others in understanding and evaluating our operating results. These non-IFRS financial measures adjust for the impact of items that we do not consider indicative of the operational performance of our business. While we believe that these non-IFRS financial measures are useful in evaluating our business, this information should be considered as supplemental in nature and is not meant as a substitute for the related financial information prepared and presented in accordance with IFRS. Please refer to our financial statements at the end of this announcement for a table reconciling our non-IFRS financial measures to net income (loss), the most directly comparable IFRS financial measure.
Safe harbor statement
This press release contains statements of a forward-looking nature. These statements, including statements relating to the Company and its investees’ future financial and operating results, are made under the “safe harbor” provisions of the U.S. Private Securities Litigation Reform Act of 1995. You can identify these forward-looking statements by terminology such as “will,” “may,” “expect,” “believe,” “anticipate,” “intend,” “aim,” “estimate,” “intend,” “seek, ” “plan,” “potential,” “continue,” “ongoing,” “target,” “guidance,” “is/are likely to,” “future” and similar statements. Among other things, management’s quotations and the Business outlook section contain forward-looking statements. The Company may also make forward-looking statements in its periodic reports to the U.S. Securities and Exchange Commission (the “SEC”), in press releases and other written materials and in oral statements made by its officers, directors or employees to third parties. These forward-looking statements involve known and unknown risks and uncertainties and are based on current expectations, assumptions, estimates and projections about the Company, its investees, and the industry in which they operate. Potential risks and uncertainties include, but are not limited to, those relating to: the duration and development of the COVID-19 pandemic as well as changes in consumer behaviors as a result of such pandemic; the outcome of regulatory processes or litigation; the Company and its goals and strategies; expected development and launch, and market acceptance, of products and services; Company and its investees’ expectations regarding demand for and market acceptance of their brands, platforms and services; Company’s expectations regarding growth in its user base, user retention and level of engagement; Company’s ability to attract, retain and monetize users; Company’s ability to continue to develop new technologies, products and services and/or upgrade its existing technologies, products and services; quarterly variations in Company’s operating results caused by factors beyond its control; and global macroeconomic conditions and their potential impact in the markets in which Company or its investees have businesses. All information provided in this press release is as of the date hereof and is based on assumptions that the Company believes to be reasonable as of this date, and it undertakes no obligation to update any forward-looking statements to reflect subsequent occurring events or circumstances, or changes in its expectations, except as may be required by law. Although the Company believes that the expectations expressed in these forward-looking statements are reasonable, it cannot assure you that its expectations will turn out to be correct, and investors are cautioned that actual results may differ materially from the anticipated results. Further information regarding risks and uncertainties faced by Opera is included in the Company’s filings with the SEC, including its annual reports on Form 20-F.


Modern brands stake on influencer marketing, with 76% of users making a purchase after seeing a product on social media.The cryptocurrency industry is no exception to this trend. However, promoting crypto products through influencer marketing can be particularly challenging. Crypto influencers pose a significant risk to a brand’s reputation and ROI due to rampant scams. Approximately 80% of channels provide fake statistics, including followers counts and engagement metrics. Additionally, this niche is characterized by high CPMs, which can increase the risk of financial loss for brands.
In this article Nadia Bubennnikova, Head of agency Famesters, will explore the most important things to look for in crypto channels to find the perfect match for influencer marketing collaborations.
-
Comments
There are several levels related to this point.
LEVEL 1
Analyze approximately 10 of the channel’s latest videos, looking through the comments to ensure they are not purchased from dubious sources. For example, such comments as “Yes sir, great video!”; “Thanks!”; “Love you man!”; “Quality content”, and others most certainly are bot-generated and should be avoided.
Just to compare:

LEVEL 2
Don’t rush to conclude that you’ve discovered the perfect crypto channel just because you’ve come across some logical comments that align with the video’s topic. This may seem controversial, but it’s important to dive deeper. When you encounter a channel with logical comments, ensure that they are unique and not duplicated under the description box. Some creators are smarter than just buying comments from the first link that Google shows you when you search “buy YouTube comments”. They generate topics, provide multiple examples, or upload lists of examples, all produced by AI. You can either manually review the comments or use a script to parse all the YouTube comments into an Excel file. Then, add a formula to highlight any duplicates.
LEVEL 3
It is also a must to check the names of the profiles that leave the comments: most of the bot-generated comments are easy to track: they will all have the usernames made of random symbols and numbers, random first and last name combinations, “Habibi”, etc. No profile pictures on all comments is also a red flag.
LEVEL 4
Another important factor to consider when assessing comment authenticity is the posting date. If all the comments were posted on the same day, it’s likely that the traffic was purchased.
2. Average views number per video
This is indeed one of the key metrics to consider when selecting an influencer for collaboration, regardless of the product type. What specific factors should we focus on?
First & foremost: the views dynamics on the channel. The most desirable type of YouTube channel in terms of views is one that maintains stable viewership across all of its videos. This stability serves as proof of an active and loyal audience genuinely interested in the creator’s content, unlike channels where views vary significantly from one video to another.
Many unauthentic crypto channels not only buy YouTube comments but also invest in increasing video views to create the impression of stability. So, what exactly should we look at in terms of views? Firstly, calculate the average number of views based on the ten latest videos. Then, compare this figure to the views of the most recent videos posted within the past week. If you notice that these new videos have nearly the same number of views as those posted a month or two ago, it’s a clear red flag. Typically, a YouTube channel experiences lower views on new videos, with the number increasing organically each day as the audience engages with the content. If you see a video posted just three days ago already garnering 30k views, matching the total views of older videos, it’s a sign of fraudulent traffic purchased to create the illusion of view stability.
3. Influencer’s channel statistics
The primary statistics of interest are region and demographic split, and sometimes the device types of the viewers.
LEVEL 1
When reviewing the shared statistics, the first step is to request a video screencast instead of a simple screenshot. This is because it takes more time to organically edit a video than a screenshot, making it harder to manipulate the statistics. If the creator refuses, step two (if only screenshots are provided) is to download them and check the file’s properties on your computer. Look for details such as whether it was created with Adobe Photoshop or the color profile, typically Adobe RGB, to determine if the screenshot has been edited.
LEVEL 2
After confirming the authenticity of the stats screenshot, it’s crucial to analyze the data. For instance, if you’re examining a channel conducted in Spanish with all videos filmed in the same language, it would raise concerns to find a significant audience from countries like India or Turkey. This discrepancy, where the audience doesn’t align with regions known for speaking the language, is a red flag.
If we’re considering an English-language crypto channel, it typically suggests an international audience, as English’s global use for quality educational content on niche topics like crypto. However, certain considerations apply. For instance, if an English-speaking channel shows a significant percentage of Polish viewers (15% to 30%) without any mention of the Polish language, it could indicate fake followers and views. However, if the channel’s creator is Polish, occasionally posts videos in Polish alongside English, and receives Polish comments, it’s important not to rush to conclusions.
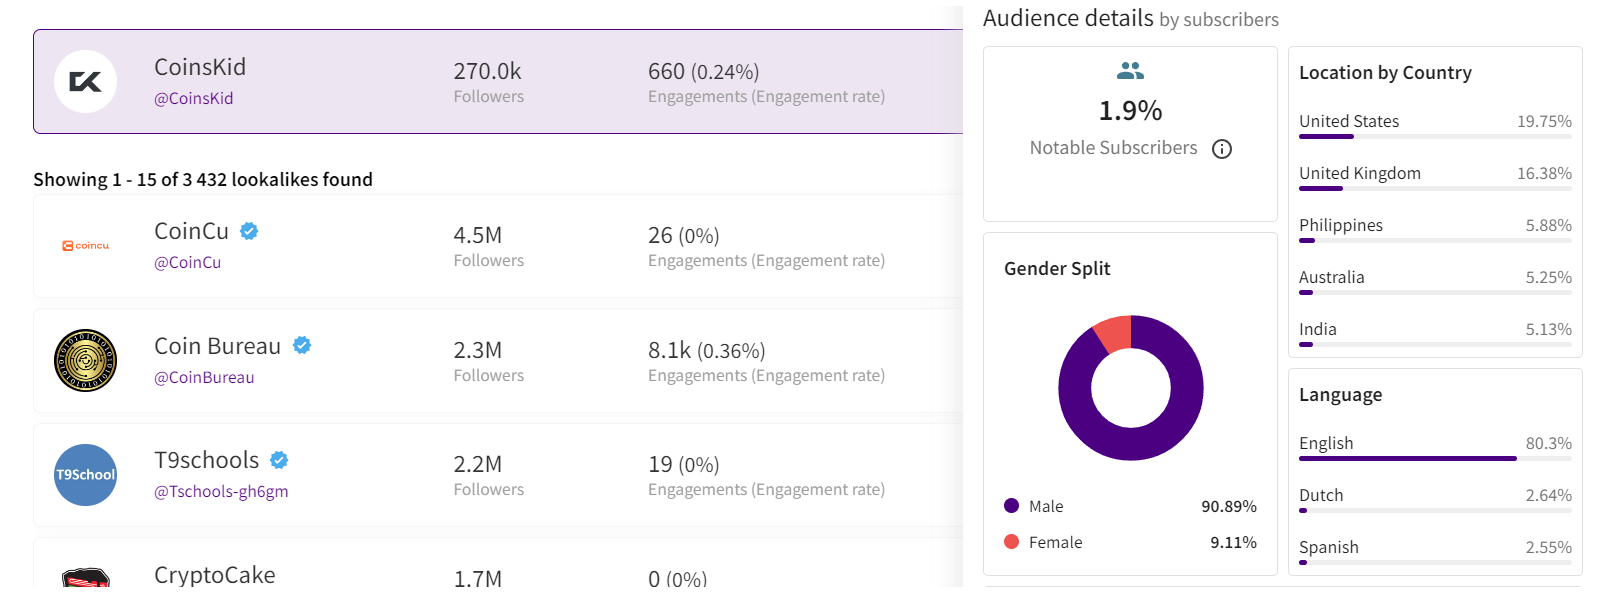 Example of statistics
Wrapping up
These are the main factors to consider when selecting an influencer to promote your crypto product. Once you’ve launched the campaign, there are also some markers to show which creators did bring the authentic traffic and which used some tools to create the illusion of an active and engaged audience. While this may seem obvious, it’s still worth mentioning. After the video is posted, allow 5-7 days for it to accumulate a basic number of views, then check performance metrics such as views, clicks, click-through rate (CTR), signups, and conversion rate (CR) from clicks to signups.
If you overlooked some red flags when selecting crypto channels for your launch, you might find the following outcomes: channels with high views numbers and high CTRs, demonstrating the real interest of the audience, yet with remarkably low conversion rates. In the worst-case scenario, you might witness thousands of clicks resulting in zero to just a few signups. While this might suggest technical issues in other industries, in crypto campaigns it indicates that the creator engaged in the campaign not only bought fake views and comments but also link clicks. And this happens more often than you may realize.
Summing up, choosing the right crypto creator to promote your product is indeed a tricky job that requires a lot of resources to be put into the search process.

Author
Nadia Bubennikova, Head of agency at Famesters
The BIS, along with seven leading central banks and a cohort of private financial firms, has embarked on an ambitious venture known as Project Agorá.
Named after the Greek word for “marketplace,” this initiative stands at the forefront of exploring the potential of tokenisation to significantly enhance the operational efficiency of the monetary system worldwide.
Central to this pioneering project are the Bank of France (on behalf of the Eurosystem), the Bank of Japan, the Bank of Korea, the Bank of Mexico, the Swiss National Bank, the Bank of England, and the Federal Reserve Bank of New York. These institutions have joined forces under the banner of Project Agorá, in partnership with an extensive assembly of private financial entities convened by the Institute of International Finance (IIF).
At the heart of Project Agorá is the pursuit of integrating tokenised commercial bank deposits with tokenised wholesale central bank money within a unified, public-private programmable financial platform. By harnessing the advanced capabilities of smart contracts and programmability, the project aspires to unlock new transactional possibilities that were previously infeasible or impractical, thereby fostering novel opportunities that could benefit businesses and consumers alike.
The collaborative effort seeks to address and surmount a variety of structural inefficiencies that currently plague cross-border payments. These challenges include disparate legal, regulatory, and technical standards; varying operating hours and time zones; and the heightened complexity associated with conducting financial integrity checks (such as anti-money laundering and customer verification procedures), which are often redundantly executed across multiple stages of a single transaction due to the involvement of several intermediaries.
As a beacon of experimental and exploratory projects, the BIS Innovation Hub is committed to delivering public goods to the global central banking community through initiatives like Project Agorá. In line with this mission, the BIS will soon issue a call for expressions of interest from private financial institutions eager to contribute to this ground-breaking project. The IIF will facilitate the involvement of private sector participants, extending an invitation to regulated financial institutions representing each of the seven aforementioned currencies to partake in this transformative endeavour.
Source: fintech.globa
The post Central banks and the FinTech sector unite to change global payments space appeared first on HIPTHER Alerts.

TD Bank has inked a multi-year deal with Google Cloud as it looks to streamline the development and deployment of new products and services.
The deal will see the Canadian banking group integrate the vendor’s cloud services into a wider portion of its technology solutions portfolio, a move which TD expects will enable it “to respond quickly to changing customer expectations by rolling out new features, updates, or entirely new financial products at an accelerated pace”.
This marks an expansion of the already established relationship between TD Bank and Google Cloud after the group previously adopted the vendor’s Google Kubernetes Engine (GKE) for TD Securities Automated Trading (TDSAT), the Chicago-based subsidiary of its investment banking unit, TD Securities.
TDSAT uses GKE for process automation and quantitative modelling across fixed income markets, resulting in the development of a “data-driven research platform” capable of processing large research workloads in trading.
Dan Bosman, SVP and CIO of TD Securities, claims the infrastructure has so far supported TDSAT with “compute-intensive quantitative analysis” while expanding the subsidiary’s “trading volumes and portfolio size”.
TD’s new partnership with Google Cloud will see the group attempt to replicate the same level of success across its entire portfolio.
Source: fintechfutures.com
The post TD Bank inks multi-year strategic partnership with Google Cloud appeared first on HIPTHER Alerts.


-

 Fintech6 days ago
How to identify authenticity in crypto influencer channels
-
Latest News5 days ago
HSBC-backed fintech Monese is considering splitting its operations as it grapples with increasing losses.
-
Latest News5 days ago
EverBank has announced a groundbreaking partnership with Finzly, poised to revolutionize payment processing.
-
Latest News5 days ago
FinTech leaders express caution regarding the promises made in #Budget2024 concerning open banking, stating that the “devil is in the details.”
-
Latest News5 days ago
Gotion High-tech’s operating profit up 391% in 2023, nearly RMB 2.8 billion invested in R&D for the year
-
Latest News5 days ago
Aurionpro Solutions acquires Arya.ai, to power next generation Enterprise AI platforms for Financial Institutions
-
Latest News5 days ago
Wells Fargo, a leading financial institution, is set to revolutionize its trade finance operations by incorporating artificial intelligence (AI) technology through its collaboration with TradeSun.
-
Latest News5 days ago
Latvian Fintech inGain Raises €650,000 for No-Code SaaS Loan Management System