

Fintech
EVERI REPORTS RECORD SECOND QUARTER 2022 RESULTS

Everi Holdings Inc. (NYSE: EVRI) (“Everi” or the “Company”), a premier provider of land-based and digital casino gaming content and products, financial technology and player loyalty solutions, today announced results for the second quarter ended June 30, 2022. Everi also reiterated its full year outlook for Net income, Adjusted EBITDA and Free Cash Flow.
Second Quarter 2022 Financial Highlights
- Revenues grew 14% to an all-time quarterly record $197.2 million from $172.6 million in the 2021 second quarter, reflecting a 7% increase in recurring revenues to a quarterly record $139.7 million and a 37% increase in sales of gaming machines and FinTech hardware.
- Income before income tax increased 16% to a record $42.3 million compared to $36.6 million a year ago.
- Net income was $32.5 million, or $0.33 per diluted share, compared to $36.2 million, or $0.36 per diluted share, in the 2021 second quarter, as the provision for income taxes increased $9.3 million in the 2022 second quarter related to the reversal of deferred tax asset valuation allowance in the 2021 fourth quarter; cash taxes paid were essentially flat at $0.1 million.
- Adjusted EBITDA, a non-GAAP financial measure, increased to an all-time quarterly record $94.4 million compared to $92.5 million in the 2021 second quarter.
- Free Cash Flow, a non-GAAP financial measure, rose 26% to $49.5 million from $39.2 million in the 2021 second quarter.
- Repurchased 2.0 million shares of stock for $33.3 million in the 2022 second quarter.
Randy Taylor, Chief Executive Officer of Everi, said, “Our strong operating momentum continued in the second quarter, as we delivered all-time quarterly record revenues, income before income tax, Adjusted EBITDA and Free Cash Flow. These record financial results were driven by another consecutive quarter of record recurring revenues for both our Games and FinTech businesses despite the very challenging year-over-year comparison for these operations, as last year’s results included the significant benefit from casino reopening activities and financial stimulus payments provided to consumers.
“Our second quarter Games segment results include our highest-ever quarterly level of gaming machines sold, which increased 40% to 1,957 units; and the 13th consecutive quarterly sequential increase in our installed base of gaming operations units. Our ongoing investments in the development of differentiated cabinets and expansion of our games portfolio continues to drive increases in our installed base, strong Daily Win per Unit, and growth in our ship share of units sold. In particular, the record number of units sold in the quarter reinforces our confidence in our ability to achieve our 15% ship share target over the next several years.
“Our FinTech segment is achieving similar success, as it generated record revenues, operating income and Adjusted EBITDA for the third consecutive quarter. The record quarterly performance was driven by increased revenues from financial access services, which included more than $10 billion of funding delivered to our customers’ casino floors for the second consecutive quarter, a record number of kiosk sales, and ongoing organic growth of our Loyalty and RegTech solutions. These results demonstrate our ability to offer industry-leading, integrated solutions that help drive increases in same-store activity and cost efficiencies for our customers. With our planned introductions of additional innovative products to our Digital Neighborhood of integrated solutions, our FinTech business is positioned to deliver consistent growth.
“Our top-line growth and focus on operational excellence continues to result in strong Free Cash Flow generation, which reached $49.5 million in the 2022 second quarter and $101.1 million for the first six months of 2022. We remain focused on allocating our higher Free Cash Flow to further grow the business through prudent investments in product development, as well as with acquisitions of businesses and technologies that continue to expand the scale and scope of our product offerings and/or drive our entry into new product categories and geographical markets. As reflected in the growing contributions of our Loyalty products, our return-focused approach to acquisitions benefits our operating performance. We expect recent acquisitions, which have expanded our addressable market to include opportunities in Australia and Historical Horse Racing gaming devices, will deliver similar benefits over time. Our Free Cash Flow performance, liquidity, and strong balance sheet also enabled us to opportunistically act on our share repurchase program in the second quarter given our view that our current valuation does not fully reflect the strength of our business and our outlook for ongoing growth.”
|
Consolidated Full Quarter Comparative Results (unaudited) |
|
As of and for the Three Months |
|||
|
2022 |
2021 |
||
|
(in millions, except per share amounts) |
|||
|
Revenue |
$ 197.2 |
$ 172.6 |
|
|
Operating income (1) |
$ 54.5 |
$ 54.4 |
|
|
Net income (1) |
$ 32.5 |
$ 36.2 |
|
|
Net earnings per diluted share (1) |
$ 0.33 |
$ 0.36 |
|
|
Weighted average diluted shares outstanding |
98.7 |
100.0 |
|
|
Adjusted EBITDA (2) |
$ 94.4 |
$ 92.5 |
|
|
Free Cash Flow (2) |
$ 49.5 |
$ 39.2 |
|
|
Principal amount of outstanding debt |
$ 995.5 |
$ 1,144.6 |
|
|
Cash and cash equivalents |
$ 238.1 |
$ 340.4 |
|
|
Net Cash Position (3) |
$ 93.1 |
$ 196.6 |
|
|
(1) |
Operating income, net income, and net earnings per diluted share for the three months ended June 30, 2022, included $0.7 million for office and warehouse consolidation costs, and $0.9 million in professional fees associated with acquisitions and for non-recurring litigation costs. |
|
(2) |
For a reconciliation of net income to Adjusted EBITDA and Free Cash Flow, see the Unaudited Reconciliation of Selected Financial GAAP to Non-GAAP Measures provided toward the end of this release. |
|
(3) |
For a reconciliation of Net Cash Position to Cash and Cash Equivalents, see the Unaudited Reconciliation of Cash and Cash Equivalents to Net Cash Position and Net Cash Available toward the end of this release. |
Second Quarter 2022 Results Overview
Revenues for the three-month period ended June 30, 2022 increased 14% to $197.2 million compared to $172.6 million in the second quarter of 2021. Recurring revenues grew 7% to $139.7 million and revenues from non-recurring sales increased 37% to $57.5 million.
Operating income for the 2022 second quarter was $54.5 million compared to $54.4 million in the prior-year period, and net income was $32.5 million, or $0.33 per diluted share, compared to $36.2 million, or $0.36 per diluted share, in the second quarter of 2021. The provision for income taxes increased $9.3 million in the 2022 second quarter related to the reversal of deferred tax asset valuation allowance in the 2021 fourth quarter. Operating margin declined from the prior-year period, reflecting a change in the revenue mix as a result of substantially greater growth in gaming machine and FinTech hardware sales year over year together with a lower margin on machine and hardware sales due to increased supply chain costs, higher operating costs that reflect the additions of acquisitions, and higher research and development expense that supports the Company’s focus on increased internal, new product development. Adjusted EBITDA increased to $94.4 million from $92.5 million in the prior-year period.
Free Cash Flow increased to $49.5 million from $39.2 million in the year-ago period, reflecting higher Adjusted EBITDA and lower cash interest paid, partially offset by higher capital expenditures.
|
Games Segment Full Quarter Comparative Results (unaudited) |
|
Three Months Ended June 30, |
|||
|
2022 |
2021 |
||
|
(in millions, except unit amounts and prices) |
|||
|
Games revenues |
|||
|
Gaming operations – Land-based casinos |
$ 68.2 |
$ 69.6 |
|
|
Gaming operations – Digital iGaming |
5.8 |
3.6 |
|
|
Gaming operations – Total |
74.0 |
73.2 |
|
|
Gaming equipment and systems |
38.3 |
26.1 |
|
|
Gaming other |
— |
— |
|
|
Games total revenues |
$ 112.3 |
$ 99.3 |
|
|
Operating income (1) |
$ 28.9 |
$ 30.6 |
|
|
Adjusted EBITDA (2) |
$ 58.7 |
$ 60.4 |
|
|
Capital expenditures |
$ 28.9 |
$ 21.3 |
|
|
Gaming operations information: |
|||
|
Units installed at period end: |
|||
|
Class II |
9,792 |
9,422 |
|
|
Class III |
7,672 |
6,829 |
|
|
Total installed base at period end (3) |
17,464 |
16,251 |
|
|
Premium units (3) |
8,355 |
6,961 |
|
|
Average units installed during period (3) |
17,362 |
16,088 |
|
|
Daily win per unit (“DWPU”) (4) |
$ 39.94 |
$ 45.66 |
|
|
Unit sales information: |
|||
|
Units sold |
1,957 |
1,402 |
|
|
Average sales price (“ASP”) |
$ 18,800 |
$ 17,894 |
|
|
(1) |
Operating income for the three months ended June 30, 2022, included $0.7 million for office and warehouse consolidation costs and professional fees associated with acquisitions. |
|
(2) |
For a reconciliation of net income to Adjusted EBITDA, see the Unaudited Reconciliation of Selected Financial GAAP to Non-GAAP measures provided toward the end of this release. |
|
(3) |
The ending and average installed base include all units, whether or not casinos were open and whether or not the games were active. |
|
(4) |
Daily win per unit reflects the total of all units installed at casinos, inclusive of casinos closed due to the COVID pandemic and inactive units, where such units would have recorded no revenue and excludes the impact of the direct costs associated with the Company’s wide-area progressive jackpot expense. |
2022 Second Quarter Games Segment Highlights
Games segment revenues grew 13% to a record $112.3 million compared to $99.3 million in the second quarter of 2021, primarily driven by record sales of gaming machines and ongoing growth in digital gaming revenues.
Operating income was $28.9 million compared to $30.6 million in the second quarter of 2021, reflecting higher revenues from machine sales, offset by lower margins on the machine sales due to increased supply chain costs as well as higher operating expenses, including increased costs associated with acquisitions and higher research and development expense, reflecting an acceleration in games development to support a path to a targeted future 15% ship share of gaming machines sold. Adjusted EBITDA was $58.7 million compared to $60.4 million in the second quarter of 2021. Revenues from the recent acquisitions of Intuicode Gaming and certain assets of Atlas Gaming (Australia) contributed $1.4 million in the 2022 second quarter.
Gaming operations revenues were $74.0 million compared to $73.2 million a year ago, and increased 5% on a quarterly sequential basis.
- The installed base reached a record 17,464 units as of June 30, 2022; representing a year-over-year increase of 7%, or 1,213 units. The installed base increased by 136 units on a quarterly sequential basis.
- The premium portion of the installed base increased by 20%, or 1,394 units, year over year and by 276 units on a quarterly sequential basis to a record 8,355 units. This was the 16th consecutive quarterly sequential increase in premium units. Growth was driven in part by continued placements of Cashnado™ units, the initial installations of Smokin’ Hot Stuff Fire and Ice™, the Company’s popular premium mechanical reel games, and its Wide-area Progressive (“WAP”) gaming machines.
- Daily Win per Unit (“DWPU”) was $39.94 in the second quarter of 2022 compared to $45.66 in the second quarter of 2021. DWPU in the year-ago period included the significant benefit of government stimulus payments coupled with pent-up demand as COVID vaccinations increased and consumers began to return to normalized activities. DWPU improved on a quarterly sequential basis from $39.76 in the 2022 first quarter.
- Gaming operations revenues from digital gaming rose 61% to $5.8 million in the second quarter of 2022 compared to $3.6 million in the second quarter of 2021, and increased 5% on a quarterly sequential basis. Digital revenue growth reflects the continued growth and expanded base of iGaming operator sites featuring Everi’s games along with a growing library of available slot content, as well as going live in Ontario, Canada with nine operator sites as of June 30, 2022.
Gaming equipment and systems revenues generated from the sale of gaming machines and other related parts and equipment increased 47% to $38.3 million in the second quarter of 2022 compared to $26.1 million in the second quarter of 2021.
- The Company sold an all-time record 1,957 gaming machines at an average selling price (“ASP”) of $18,800 in the 2022 second quarter, up 555 units, or 40%, from 1,402 units sold at an ASP of $17,894 in the 2021 second quarter, which had included a larger-than-average number of unit sales for new casino openings and expansions. Unit growth reflects the Company’s estimation of an improved industry ship share driven by the popularity of an expanding game library supporting the Empire Flex™ video reel cabinet, ongoing demand for the Player Classic™ mechanical reel cabinet, and sales of the newly launched Player Classic Signature™ mechanical reel cabinet.
|
Financial Technology Solutions Segment Full Quarter Comparative Results (unaudited) |
|
Three Months Ended June 30, |
|||
|
2022* |
2021* |
||
|
(in millions, unless otherwise noted) |
|||
|
FinTech revenues |
|||
|
Financial access services |
$ 50.9 |
$ 44.8 |
|
|
Software and other |
19.0 |
15.6 |
|
|
Hardware |
15.0 |
12.8 |
|
|
FinTech total revenues |
$ 84.9 |
$ 73.2 |
|
|
Operating income (1) |
$ 25.7 |
$ 23.8 |
|
|
Adjusted EBITDA (2) |
$ 35.7 |
$ 32.1 |
|
|
Capital expenditures |
$ 7.5 |
$ 7.9 |
|
|
Value of financial access transactions: |
|||
|
Funds advanced |
$ 2,661.1 |
$ 2,210.9 |
|
|
Funds dispensed |
7,511.0 |
6,960.1 |
|
|
Check warranty |
439.1 |
378.8 |
|
|
Total value processed |
$ 10,611.2 |
$ 9,549.8 |
|
|
Number of financial access transactions: |
|||
|
Funds advanced |
3.5 |
3.3 |
|
|
Funds dispensed |
28.6 |
28.4 |
|
|
Check warranty |
1.2 |
0.9 |
|
|
Total transactions completed |
33.3 |
32.6 |
|
|
* |
Rounding may cause variances. |
|
(1) |
Operating income for the three months ended June 30, 2022, included $0.9 million for professional fees associated with certain acquisitions and non-recurring litigation costs. |
|
(2) |
For a reconciliation of net income to Adjusted EBITDA, see the Unaudited Reconciliation of Selected Financial GAAP to Non-GAAP Measures provided toward the end of this release. |
2022 Second Quarter Financial Technology Solutions (“FinTech”) Segment Highlights
FinTech revenues for the 2022 second quarter increased 16% to an all-time quarterly record $84.9 million compared to $73.2 million in the 2021 second quarter, reflecting a 14% increase in financial access services, a 22% increase in software and other revenues, and a 17% improvement in revenues from hardware sales. Revenues from the recent acquisition of ecash Holdings (Australia) contributed $4.2 million in the 2022 second quarter.
Operating income increased 8% to $25.7 million in the 2022 second quarter compared to $23.8 million in the prior-year period, reflecting a benefit from higher revenues partially offset by increased research and development expense primarily in support of new and enhanced Loyalty products, the Company’s digital CashClub Wallet®, and new RegTech products and software. Adjusted EBITDA rose 11% to $35.7 million compared to $32.1 million in the 2021 second quarter.
- Financial access services revenues, which include cashless and cash-dispensing debit and credit card transactions and check services, was a quarterly record $50.9 million, a 14% increase compared with the 2021 second quarter, reflecting continued strength in financial funding transactions at casinos, as well as growth from new customer additions. The number of completed financial transactions increased 2% year over year and for the second consecutive quarter delivered more than $10 billion of funding to customers’ casino floors, representing a year-over-year funding increase of 11%. The Company’s CashClub Wallet digital technology is currently deployed across six jurisdictions at 19 casinos, with 20 additional casino properties under various stages of deployment.
- Software and other revenues, which include Loyalty and RegTech software, product subscriptions, kiosk maintenance services, and other revenues, rose 22% to $19.0 million in the second quarter of 2022 compared to $15.6 million in the second quarter 2021. Approximately 78% and 80% of software and other revenues were of a recurring nature in the 2022 and 2021 second quarter periods, respectively.
- Hardware sales revenues increased 17% to a record $15.0 million compared to $12.8 million in the second quarter of 2021. The record level of self-service kiosks and other cash access hardware products sold in the quarter reflect significant continued demand for the Company’s hardware and software solutions that deliver optimal performance and cost efficiencies to casino operators, including voucher redemption kiosks sold in Australia as a result of the ecash Holdings acquisition.
Balance Sheet and Liquidity
- As of June 30, 2022, the Company had $238.1 million of cash and cash equivalents, and its Net Cash Position was $93.1 million.
- The Company repurchased 2.0 million shares of its common stock for total consideration of $33.3 million during the quarter, and as of June 30, 2022, had $116.7 million remaining under the Board’s $150 million authorization announced on May 10, 2022.
- In the 2022 second quarter, the Company paid $14.1 million for the initial purchase price payment and the net working capital payment related to the acquisition of Intuicode Gaming, $6.0 million of consideration related to the acquisition of certain assets of ecash Holdings and $2.0 million related to the acquisition of certain assets of XUVI.
Outlook
Reflecting the operating performance in the first half of the year and the Company’s expectations for continued operating execution over the balance of the year driven by demand for its products, Everi reiterated its full year 2022 guidance for net income of $125 million to $132 million, Adjusted EBITDA of $368 million to $378 million and Free Cash Flow of $187 million to $200 million.
The Company’s year-to-date results have not reflected, and its updated guidance does not contemplate, any additional material impact from a pandemic-related setback or other macroeconomic effect, such as recessionary or inflationary influence on consumer spending, a material supply chain disruption, or other changes in global market conditions. A summary and reconciliation of the full year 2022 financial targets are included in a supplemental table at the end of this release.
Investor Conference Call and Webcast
The Company will host an investor conference call to discuss its 2022 second quarter results at 11:00 a.m. EDT (8:00 a.m. PDT) today. The conference call may be accessed live by phone by dialing (201) 689-8471. A replay of the call will be available beginning at 2:00 p.m. ET today and may be accessed by dialing (412) 317-6671; the PIN number is 13730679. A replay will be available until August 10, 2022. The call also will be webcast live and archived on www.everi.com (select “Investors” followed by “Events & Contact”).
Non-GAAP Financial Information
In order to enhance investor understanding of the underlying trends in our business, our cash balance, and cash available for our operating needs, and to provide for better comparability between periods in different years, we are providing in this press release Adjusted EBITDA, Free Cash Flow, Net Cash Position and Net Cash Available, which are not measures of our financial performance or position under United States Generally Accepted Accounting Principles (“GAAP”). Accordingly, Adjusted EBITDA and Free Cash Flow should not be considered in isolation or as a substitute for measures prepared in accordance with GAAP. These measures should be read in conjunction with our net earnings, operating income, and cash flow data prepared in accordance with GAAP. With respect to Net Cash Position and Net Cash Available, these measures should be read in conjunction with cash and cash equivalents prepared in accordance with GAAP.
We define Adjusted EBITDA as earnings (loss) before interest, taxes, depreciation and amortization, loss on extinguishment of debt, non-cash stock compensation expense, accretion of contract rights, write-downs of inventory, property and equipment and intangible assets, employee severance costs and other related expenses, litigation settlement received net of legal costs, foreign exchange loss, asset acquisition expense, non-recurring professional fees, certain litigation costs, and one-time charges. We present Adjusted EBITDA, as we use this measure to manage our business and consider this measure to be supplemental to our operating performance. We also make certain compensation decisions based, in part, on our operating performance, as measured by Adjusted EBITDA; and our current credit facility and existing senior unsecured notes require us to comply with a consolidated secured leverage ratio that includes performance metrics substantially similar to Adjusted EBITDA.
We define Free Cash Flow as Adjusted EBITDA less cash paid for interest, cash paid for capital expenditures, cash paid for placement fees, and cash paid for taxes net of refunds. We present Free Cash Flow as a measure of performance and believe it provides investors with another indicator of our operating performance. It should not be inferred that the entire Free Cash Flow amount is available for discretionary expenditures.
A reconciliation of the Company’s net income (loss) per GAAP to Adjusted EBITDA and Free Cash Flow is included in the Unaudited Reconciliation of Selected Financial GAAP to Non-GAAP Measures provided at the end of this release. Additionally, a reconciliation of each segment’s operating income to EBITDA and Adjusted EBITDA is also included. On a segment level, operating income per GAAP, rather than net earnings per GAAP, is reconciled to EBITDA and Adjusted EBITDA as the Company does not report net earnings by segment. Management believes that this presentation is meaningful to investors in evaluating the performance of the Company’s segments.
We define (i) Net Cash Position as cash and cash equivalents plus settlement receivables less settlement liabilities and (ii) Net Cash Available as Net Cash Position plus undrawn amounts available under our revolving credit facility. We present Net Cash Position because our cash position, as measured by cash and cash equivalents, depends upon changes in settlement receivables and the timing of payments related to settlement liabilities. As such, our cash and cash equivalents can change substantially based upon the timing of our receipt of payments for settlement receivables and payments we make to customers for our settlement liabilities. We present Net Cash Available as management monitors this amount in connection with its forecasting of cash flows and future cash requirements.
A reconciliation of the Company’s cash and cash equivalents per GAAP to Net Cash Position and Net Cash Available is included in the Unaudited Reconciliation of Cash and Cash Equivalents to Net Cash Position and Net Cash Available provided at the end of this release.
Cautionary Note Regarding Forward-Looking Statements
This press release contains “forward-looking statements” as defined in the U.S. Private Securities Litigation Reform Act of 1995. Forward-looking statements are neither historical facts nor assurances of future performance, but instead are based only on our current beliefs, expectations, and assumptions regarding the future of our business, plans and strategies, projections, anticipated events and trends, the economy, and other future conditions, as of the date this press release is issued. Forward-looking statements often, but do not always, contain words such as “expect,” “anticipate,” “aim to,” “designed to,” “intend,” “plan,” “believe,” “goal,” “target,” “future,” “assume,” “estimate,” “indication,” “seek,” “project,” “may,” “can,” “could,” “should,” “favorably positioned,” or “will” and other words and terms of similar meaning. Readers are cautioned not to place undue reliance on the forward-looking statements contained herein, which are based only on information currently available to us and only as of the date hereof.
Examples of forward-looking statements include, among others, statements regarding our ability to execute on key initiatives and deliver ongoing operating and financial improvements, including guidance related to 2022 financial and operational metrics; regain or maintain revenue, earnings and Free Cash Flow momentum; sustain our overall growth; drive growth of the gaming operations installed base and DWPU; continue expanding the portions of the gaming floor the Company’s games address, including into the Historical Horse Racing category of gaming devices and the Company’s overall targeted ship share of gaming machines sold; successfully perform obligations required by acquisition agreements; and create incremental value for our shareholders, as well as statements regarding our expectations for the industry environment and the adoption of our products and technologies.
Forward-looking statements are subject to inherent risks, uncertainties, and changes in circumstances that are often difficult to predict and many of which are beyond our control, including, but not limited to, statements regarding: trends, developments, and uncertainties impacting our business, including our ability to withstand: global supply chain disruption; inflationary impact on supply chain costs; changes in global market, business and regulatory conditions arising as a result of the COVID-19 global pandemic, including any related public health confidence and availability of discretionary spending income of casino patrons, as well as expectations for the re-opening of casinos; product innovations that address customer needs in a new and evolving operating environment; to regain or maintain revenue, earnings, and cash flow momentum, and to enhance shareholder value in the long-term; trends in gaming establishment and patron usage of our products; benefits realized by using our products and services; benefits and/or costs associated with mergers, acquisitions, and/or strategic alliances; product development, including the release of new game features, additional games, and system releases in the future; regulatory approvals; gaming and financial regulatory and legal, card association, and statutory compliance and changes; the implementation of new or amended card association and payment network rules or interpretations; consumer collection activities; competition (including consolidations); tax liabilities; goodwill impairment charges; international expansion; resolution of litigation or government investigations; our dividend policy; new customer contracts and contract renewals; financial performance and results of operations (including revenue, expenses, margins, earnings, cash flow, and capital expenditures); inflationary impact on labor costs and retention; interest rates and interest expense; borrowings and debt repayments; and equity incentive activity and compensation expense.
Our actual results and financial condition may differ materially from those indicated in forward-looking statements, and important factors that could cause them to do so include, but are not limited to, the following: our ability to generate profits in the future and to create incremental value for shareholders; our ability to withstand inflationary and other factors that pressure discretionary consumer spending; our ability to execute on mergers, acquisitions and/or strategic alliances, including our ability to integrate and operate such acquisitions or alliances consistent with our forecasts in order to achieve future growth; our ability to execute on key initiatives and deliver ongoing improvements; expectations regarding growth for the Company’s installed base and daily win per unit; expectations regarding placement fee arrangements; inaccuracies in underlying operating assumptions; the impact of the ongoing Coronavirus Disease 2019 (“COVID-19”) global pandemic on our business, operations and financial condition, including (i) actions taken by international, federal, state, tribal and municipal governmental and regulatory agencies to contain the COVID-19 public health emergency or mitigate its impact, (ii) the direct and indirect economic effects of COVID-19 and measures to contain it, including directives, orders or similar actions by international, federal, state, tribal and municipal governmental and regulatory agencies to regulate freedom of movement and business operations such as travel restrictions, border closures, business closures, limitations on public gatherings, quarantines and shelter-in-place orders as well as re-opening safety protocols; changes in global market, business, and regulatory conditions arising as a result of the COVID-19 global pandemic; our history of net losses and our ability to generate profits in the future; our leverage and the related covenants that restrict our operations; our ability to withstand unanticipated impacts of a pandemic outbreak of uncertain duration; our ability to withstand the loss of revenue during the closure of our customers’ facilities; our ability to generate sufficient cash to service all of our indebtedness, fund working capital, and capital expenditures; our ability to maintain our current customers; expectations regarding customers’ preferences and demands for future product and service offerings; the overall growth of the gaming industry, if any; our ability to replace revenue associated with terminated contracts; margin degradation from contract renewals; our ability to comply with the Europay, MasterCard, and Visa global standard for cards equipped with security chip technology; our ability to successfully introduce new products and services, including third-party licensed content; gaming establishment and patron preferences; failure to control product development costs and create successful new products; anticipated sales performance; our ability to prevent, mitigate, or timely recover from cybersecurity breaches, attacks, and compromises; national and international economic and industry conditions; changes in gaming regulatory, card association, and statutory requirements; regulatory and licensing difficulties, competitive pressures and changes in the competitive environment; operational limitations; gaming market contraction; changes to tax laws; uncertainty of litigation outcomes; interest rate fluctuations; business prospects; unanticipated expenses or capital needs; technological obsolescence and our ability to adapt to evolving technologies; our ability to comply with our debt covenants and service outstanding debt; employee hiring, turnover, and retention; our ability to comply with regulatory requirements under the Payment Card Industry (“PCI”) Data Security Standards and maintain our certified status; and those other risks and uncertainties discussed in “Item 7. Management’s Discussion and Analysis of Financial Condition and Results of Operations” and “Item 1A. Risk Factors” of our Annual Report on Form 10-K for the year ended December 31, 2021 (the “Annual Report”). Given these risks and uncertainties, there can be no assurance that the forward-looking information contained in this press release will in fact transpire or prove to be accurate.
This press release should be read in conjunction with our Annual Report on Form 10-K for the year ended December 31, 2021, and with the information included in our other press releases, reports and other filings with the SEC. Understanding the information contained in these filings is important in order to fully understand our reported financial results and our business outlook for future periods.


Modern brands stake on influencer marketing, with 76% of users making a purchase after seeing a product on social media.The cryptocurrency industry is no exception to this trend. However, promoting crypto products through influencer marketing can be particularly challenging. Crypto influencers pose a significant risk to a brand’s reputation and ROI due to rampant scams. Approximately 80% of channels provide fake statistics, including followers counts and engagement metrics. Additionally, this niche is characterized by high CPMs, which can increase the risk of financial loss for brands.
In this article Nadia Bubennnikova, Head of agency Famesters, will explore the most important things to look for in crypto channels to find the perfect match for influencer marketing collaborations.
-
Comments
There are several levels related to this point.
LEVEL 1
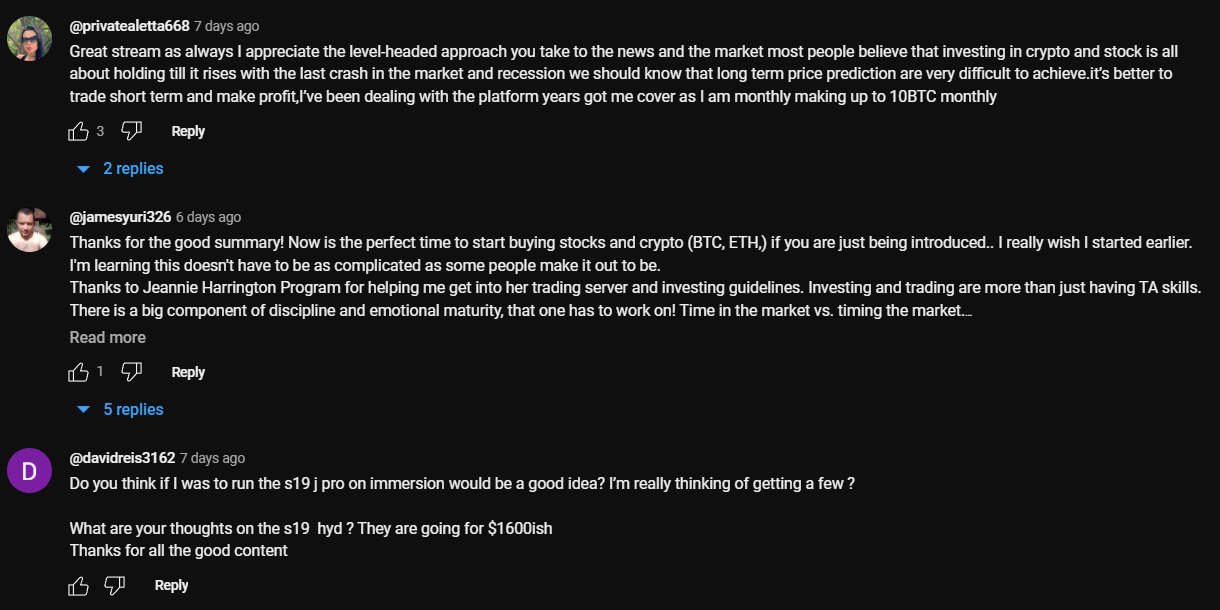
Analyze approximately 10 of the channel’s latest videos, looking through the comments to ensure they are not purchased from dubious sources. For example, such comments as “Yes sir, great video!”; “Thanks!”; “Love you man!”; “Quality content”, and others most certainly are bot-generated and should be avoided.
Just to compare:

LEVEL 2
Don’t rush to conclude that you’ve discovered the perfect crypto channel just because you’ve come across some logical comments that align with the video’s topic. This may seem controversial, but it’s important to dive deeper. When you encounter a channel with logical comments, ensure that they are unique and not duplicated under the description box. Some creators are smarter than just buying comments from the first link that Google shows you when you search “buy YouTube comments”. They generate topics, provide multiple examples, or upload lists of examples, all produced by AI. You can either manually review the comments or use a script to parse all the YouTube comments into an Excel file. Then, add a formula to highlight any duplicates.
LEVEL 3
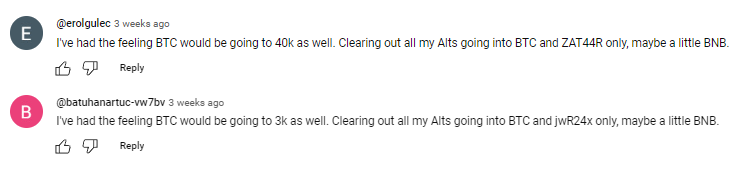
It is also a must to check the names of the profiles that leave the comments: most of the bot-generated comments are easy to track: they will all have the usernames made of random symbols and numbers, random first and last name combinations, “Habibi”, etc. No profile pictures on all comments is also a red flag.
LEVEL 4
Another important factor to consider when assessing comment authenticity is the posting date. If all the comments were posted on the same day, it’s likely that the traffic was purchased.
2. Average views number per video
This is indeed one of the key metrics to consider when selecting an influencer for collaboration, regardless of the product type. What specific factors should we focus on?
First & foremost: the views dynamics on the channel. The most desirable type of YouTube channel in terms of views is one that maintains stable viewership across all of its videos. This stability serves as proof of an active and loyal audience genuinely interested in the creator’s content, unlike channels where views vary significantly from one video to another.
Many unauthentic crypto channels not only buy YouTube comments but also invest in increasing video views to create the impression of stability. So, what exactly should we look at in terms of views? Firstly, calculate the average number of views based on the ten latest videos. Then, compare this figure to the views of the most recent videos posted within the past week. If you notice that these new videos have nearly the same number of views as those posted a month or two ago, it’s a clear red flag. Typically, a YouTube channel experiences lower views on new videos, with the number increasing organically each day as the audience engages with the content. If you see a video posted just three days ago already garnering 30k views, matching the total views of older videos, it’s a sign of fraudulent traffic purchased to create the illusion of view stability.
3. Influencer’s channel statistics
The primary statistics of interest are region and demographic split, and sometimes the device types of the viewers.
LEVEL 1
When reviewing the shared statistics, the first step is to request a video screencast instead of a simple screenshot. This is because it takes more time to organically edit a video than a screenshot, making it harder to manipulate the statistics. If the creator refuses, step two (if only screenshots are provided) is to download them and check the file’s properties on your computer. Look for details such as whether it was created with Adobe Photoshop or the color profile, typically Adobe RGB, to determine if the screenshot has been edited.
LEVEL 2
After confirming the authenticity of the stats screenshot, it’s crucial to analyze the data. For instance, if you’re examining a channel conducted in Spanish with all videos filmed in the same language, it would raise concerns to find a significant audience from countries like India or Turkey. This discrepancy, where the audience doesn’t align with regions known for speaking the language, is a red flag.
If we’re considering an English-language crypto channel, it typically suggests an international audience, as English’s global use for quality educational content on niche topics like crypto. However, certain considerations apply. For instance, if an English-speaking channel shows a significant percentage of Polish viewers (15% to 30%) without any mention of the Polish language, it could indicate fake followers and views. However, if the channel’s creator is Polish, occasionally posts videos in Polish alongside English, and receives Polish comments, it’s important not to rush to conclusions.
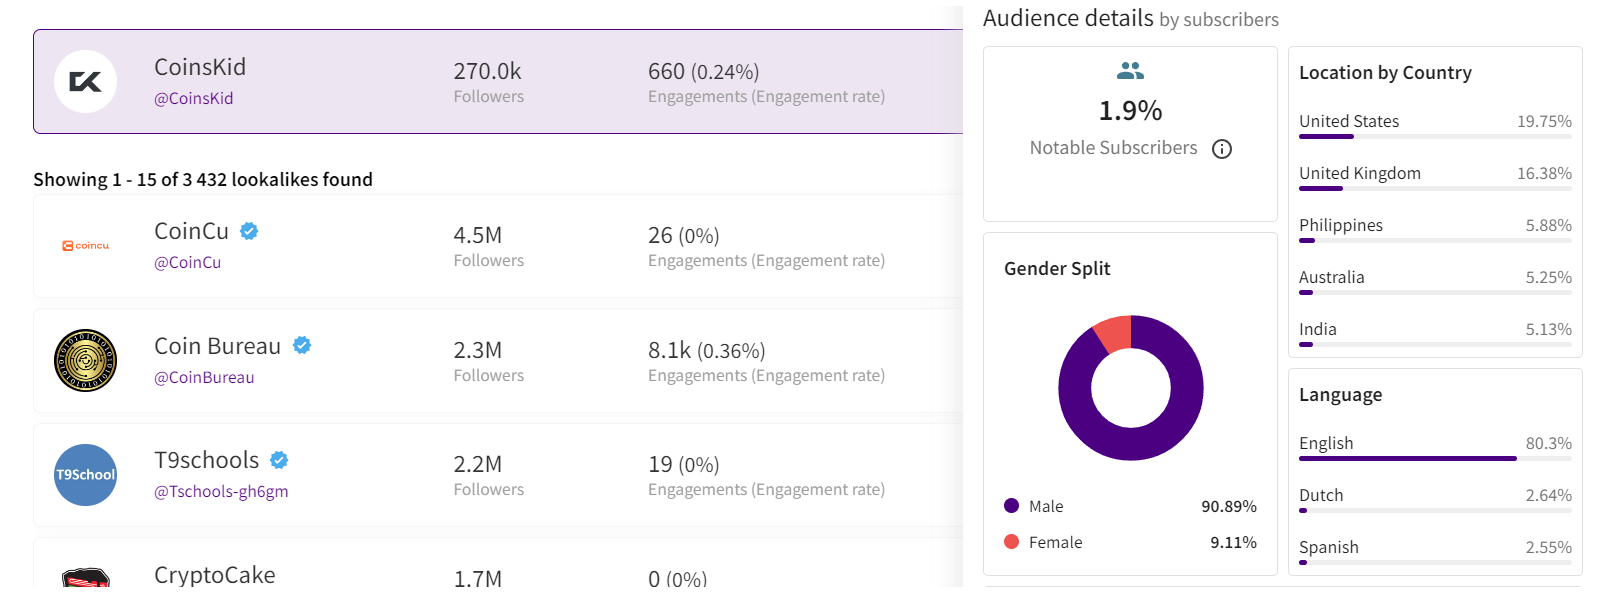 Example of statistics
Wrapping up
These are the main factors to consider when selecting an influencer to promote your crypto product. Once you’ve launched the campaign, there are also some markers to show which creators did bring the authentic traffic and which used some tools to create the illusion of an active and engaged audience. While this may seem obvious, it’s still worth mentioning. After the video is posted, allow 5-7 days for it to accumulate a basic number of views, then check performance metrics such as views, clicks, click-through rate (CTR), signups, and conversion rate (CR) from clicks to signups.
If you overlooked some red flags when selecting crypto channels for your launch, you might find the following outcomes: channels with high views numbers and high CTRs, demonstrating the real interest of the audience, yet with remarkably low conversion rates. In the worst-case scenario, you might witness thousands of clicks resulting in zero to just a few signups. While this might suggest technical issues in other industries, in crypto campaigns it indicates that the creator engaged in the campaign not only bought fake views and comments but also link clicks. And this happens more often than you may realize.
Summing up, choosing the right crypto creator to promote your product is indeed a tricky job that requires a lot of resources to be put into the search process.

Author
Nadia Bubennikova, Head of agency at Famesters

The BIS, along with seven leading central banks and a cohort of private financial firms, has embarked on an ambitious venture known as Project Agorá.
Named after the Greek word for “marketplace,” this initiative stands at the forefront of exploring the potential of tokenisation to significantly enhance the operational efficiency of the monetary system worldwide.
Central to this pioneering project are the Bank of France (on behalf of the Eurosystem), the Bank of Japan, the Bank of Korea, the Bank of Mexico, the Swiss National Bank, the Bank of England, and the Federal Reserve Bank of New York. These institutions have joined forces under the banner of Project Agorá, in partnership with an extensive assembly of private financial entities convened by the Institute of International Finance (IIF).
At the heart of Project Agorá is the pursuit of integrating tokenised commercial bank deposits with tokenised wholesale central bank money within a unified, public-private programmable financial platform. By harnessing the advanced capabilities of smart contracts and programmability, the project aspires to unlock new transactional possibilities that were previously infeasible or impractical, thereby fostering novel opportunities that could benefit businesses and consumers alike.
The collaborative effort seeks to address and surmount a variety of structural inefficiencies that currently plague cross-border payments. These challenges include disparate legal, regulatory, and technical standards; varying operating hours and time zones; and the heightened complexity associated with conducting financial integrity checks (such as anti-money laundering and customer verification procedures), which are often redundantly executed across multiple stages of a single transaction due to the involvement of several intermediaries.
As a beacon of experimental and exploratory projects, the BIS Innovation Hub is committed to delivering public goods to the global central banking community through initiatives like Project Agorá. In line with this mission, the BIS will soon issue a call for expressions of interest from private financial institutions eager to contribute to this ground-breaking project. The IIF will facilitate the involvement of private sector participants, extending an invitation to regulated financial institutions representing each of the seven aforementioned currencies to partake in this transformative endeavour.
Source: fintech.globa
The post Central banks and the FinTech sector unite to change global payments space appeared first on HIPTHER Alerts.

TD Bank has inked a multi-year deal with Google Cloud as it looks to streamline the development and deployment of new products and services.
The deal will see the Canadian banking group integrate the vendor’s cloud services into a wider portion of its technology solutions portfolio, a move which TD expects will enable it “to respond quickly to changing customer expectations by rolling out new features, updates, or entirely new financial products at an accelerated pace”.
This marks an expansion of the already established relationship between TD Bank and Google Cloud after the group previously adopted the vendor’s Google Kubernetes Engine (GKE) for TD Securities Automated Trading (TDSAT), the Chicago-based subsidiary of its investment banking unit, TD Securities.
TDSAT uses GKE for process automation and quantitative modelling across fixed income markets, resulting in the development of a “data-driven research platform” capable of processing large research workloads in trading.
Dan Bosman, SVP and CIO of TD Securities, claims the infrastructure has so far supported TDSAT with “compute-intensive quantitative analysis” while expanding the subsidiary’s “trading volumes and portfolio size”.
TD’s new partnership with Google Cloud will see the group attempt to replicate the same level of success across its entire portfolio.
Source: fintechfutures.com
The post TD Bank inks multi-year strategic partnership with Google Cloud appeared first on HIPTHER Alerts.


-
Latest News6 days ago
“The Hainan FTP and Me”: Looking at Hainan’s Transformations
-
Latest News5 days ago
Millions of people unite around doing good on the 18th International Good Deeds Day held yesterday worldwide
-
Latest News4 days ago
Banxso Acquires Australian ASIC License, Enhancing Its Global Trading Operations
-
Latest News5 days ago
135th Canton Fair Launches a Showcase of Innovative Products of New Collection to Lead Global Market Trends
-
Latest News3 days ago
BMO Announces Election of Board of Directors
-
Latest News5 days ago
BII and FMO back BECIS with joint US$50 million financing facility supporting commercial and industrial renewables sector in South-East Asia
-
Latest News5 days ago
Silent Eight secures AIA as its latest client
-
Latest News3 days ago
CGTN: China, Germany eye more resilience and vitality in bilateral ties