

Fintech PR
Focusing on High-performance Advanced Packaging and Global Layout, JCET Achieved Quarter-on-Quarter Growth in Q2 2023
Q2 2023 Financial Highlights:
- Revenue was RMB 6.31 billion, an increase of 7.7% quarter-on-quarter.
- Generated RMB 1.19 billion cash from operations. With net capex investments of RMB 0.75 billion, free cash flow for the quarter was RMB 0.44 billion.
- Net profit was RMB 0.39 billion, an increase of 250.8% quarter-on-quarter.
- Earnings per share was RMB 0.22, as compared to RMB 0.39 in Q2 2022.
1H 2023 Financial Highlights:
- Revenue was RMB 12.17 billion.
- Generated RMB 2.42 billion cash from operations. With net capex investments of RMB 1.56 billion, free cash flow for the first half of 2023 was RMB 0.86 billion.
- Net profit was RMB 0.5 billion.
- Earnings per share was RMB 0.28, as compared to RMB 0.87 in 1H 2022.
SHANGHAI, Aug. 25, 2023 /PRNewswire/ — Today, JCET Group (SSE: 600584), a leading global provider of integrated circuit (IC) back-end manufacturing and technology services, announced its financial results for the first half year of 2023. The financial report shows that in the first half of 2023, JCET achieved revenue of RMB 12.17 billion, and net profit of RMB 0.5 billion. In Q2 2023 JCET achieved revenue of RMB 6.31 billion, an increase of 7.7% quarter-on-quarter, and net profit of RMB 0.39 billion, an increase of 250.8% quarter-on-quarter.
In the first half of 2023, the global semiconductor industry was in the fluctuating stage of bottoming out and rebounding. JCET adhered to high-performance advanced packaging technologies and product development mechanism, focusing on solutions for emerging applications such as high performance computing and storage, enhanced strategic layout of production capacity, and further strengthened its market position in the global IC industry.
JCET continues to enhance its technological innovation, with R&D investment of RMB 0.67 billion in the first half of this year, a year-on-year increase of 5.0%. The company’s multi-dimensional fan-out heterogeneous integration solution XDFOI™ for 2.5D/3D packaging achieved HVM, providing high-performance chiplet package solutions and production capacity for global customers. In collaboration with multiple customers in the field of high-density SiP technology, JCET has achieved the development and mass production of multiple RFFE modules and AiP modules in the 5G millimeter-wave market. The company is intensifying its market exploration in sectors such as automotive electronics, industrial electronics, and high-performance computing. During the reporting period, revenue from automotive electronics achieved a year-on-year growth of 130%. The company has established a subsidiary with controlling stake in the Lingang New Area of Shanghai, reinforcing its strategic capacity layout in the field of automotive electronics.
In addition, the company has optimized various operational expenses and asset structures, maintaining a stable cash flow capability. It has achieved positive free cash flow for 15 consecutive quarters.
While pursuing its own development, JCET actively engages in philanthropic efforts, contributing to society in areas such as health and environmental protection, disaster relief during floods, and science popularization initiatives.
Mr. Li Zheng, CEO of JCET, said, “JCET has always centered its focus on customers, and achieved quarter-on-quarter growth in performance for the second quarter of this year. Looking ahead, the direction of high-performance advanced packaging technology driving the innovation of the IC industry has become increasingly clear. JCET remains committed to achieving high-quality development through professional and international management, and will continue to create value for investors and the IC industry.”
For more information, please refer to the JCET 1H FY2023 Report.
About JCET Group
JCET Group is the world’s leading integrated-circuit manufacturing and technology services provider, offering a full range of turnkey services that include semiconductor package integration design and characterization, R&D, wafer probe, wafer bumping, package assembly, final test and drop shipment to vendors around the world.
Our comprehensive portfolio covers a wide spectrum of semiconductor applications such as mobile, communication, compute, consumer, automotive and industry etc., through advanced wafer level packaging, 2.5D/3D, System-in-Packaging, and reliable flip chip and wire bonding technologies. JCET Group has two R&D centers in China and Korea, six manufacturing locations in China, Korea and Singapore, and sales centers around the world, providing close technology collaboration and efficient supply-chain manufacturing to customers in China and around the world.

|
CONSOLIDATED BALANCE SHEET (Unaudited) |
RMB in millions |
||||||||
|
Jun 30, 2023 |
Dec 31, 2022 |
||||||||
|
ASSETS |
|||||||||
|
Current assets |
|||||||||
|
Currency funds |
5,352 |
2,459 |
|||||||
|
Trading financial assets |
2,006 |
4,316 |
|||||||
|
Derivative financial assets |
0 |
18 |
|||||||
|
Accounts receivable |
3,545 |
3,689 |
|||||||
|
Receivables financing |
105 |
59 |
|||||||
|
Prepayments |
127 |
110 |
|||||||
|
Other receivables |
63 |
61 |
|||||||
|
Inventories |
3,003 |
3,152 |
|||||||
|
Other current assets |
251 |
279 |
|||||||
|
Total current assets |
14,452 |
14,143 |
|||||||
|
Non-current assets |
|||||||||
|
Long-term receivables |
41 |
40 |
|||||||
|
Long-term equity investments |
744 |
765 |
|||||||
|
Other equity investments |
456 |
440 |
|||||||
|
Investment properties |
87 |
89 |
|||||||
|
Fixed assets |
19,574 |
19,517 |
|||||||
|
Construction in progress |
710 |
807 |
|||||||
|
Right-of-use assets |
567 |
578 |
|||||||
|
Intangible assets |
483 |
483 |
|||||||
|
Goodwill |
2,293 |
2,210 |
|||||||
|
Long-term prepaid expenses |
22 |
28 |
|||||||
|
Deferred tax assets |
274 |
247 |
|||||||
|
Other non-current assets |
106 |
61 |
|||||||
|
Total non-current assets |
25,357 |
25,265 |
|||||||
|
Total assets |
39,809 |
39,408 |
|||||||
|
LIABILITIES AND EQUITY |
Jun 30, 2023 |
Dec 31, 2022 |
|||||||
|
Current liabilities |
|||||||||
|
Short-term borrowings |
1,211 |
1,174 |
|||||||
|
Derivative financial liabilities |
2 |
0 |
|||||||
|
Notes payable |
215 |
339 |
|||||||
|
Accounts payable |
4,603 |
4,634 |
|||||||
|
Contract liabilities |
273 |
214 |
|||||||
|
Employee benefits payable |
689 |
984 |
|||||||
|
Taxes and surcharges payable |
158 |
210 |
|||||||
|
Other payables |
396 |
378 |
|||||||
|
Current portion of long-term liabilities |
2,857 |
3,096 |
|||||||
|
Other current liabilities |
4 |
4 |
|||||||
|
Total current liabilities |
10,408 |
11,033 |
|||||||
|
Non-current liabilities |
|||||||||
|
Long-term borrowings |
3,013 |
2,721 |
|||||||
|
Lease liabilities |
549 |
562 |
|||||||
|
Long-term employee benefits payable |
11 |
14 |
|||||||
|
Deferred income |
362 |
340 |
|||||||
|
Deferred tax liabilities |
14 |
40 |
|||||||
|
Other non-current liabilities |
41 |
55 |
|||||||
|
Total non-current liabilities |
3,990 |
3,732 |
|||||||
|
Total liabilities |
14,398 |
14,765 |
|||||||
|
Equity |
|||||||||
|
Paid-in capital |
1,787 |
1,780 |
|||||||
|
Capital reserves |
15,265 |
15,080 |
|||||||
|
Accumulated other comprehensive income |
750 |
400 |
|||||||
|
Specialized reserves |
2 |
0 |
|||||||
|
Surplus reserves |
229 |
229 |
|||||||
|
Unappropriated profit |
7,292 |
7,154 |
|||||||
|
Total equity attributable to owners of the parent |
25,325 |
24,643 |
|||||||
|
Minority shareholders |
86 |
0 |
|||||||
|
Total equity |
25,411 |
24,643 |
|||||||
|
Total liabilities and equity |
39,809 |
39,408 |
|||||||
|
CONSOLIDATED INCOME STATEMENT (Unaudited) |
RMB in millions, except share data |
||||||||
|
Three months ended |
Six months ended |
||||||||
|
Jun 30, 2023 |
Jun 30, 2022 |
Jun 30, 2023 |
Jun 30, 2022 |
||||||
|
Revenue |
6,313 |
7,455 |
12,173 |
15,594 |
|||||
|
Less: Cost of sales |
5,359 |
6,107 |
10,525 |
12,706 |
|||||
|
Taxes and surcharges |
27 |
27 |
47 |
43 |
|||||
|
Selling expenses |
51 |
48 |
100 |
97 |
|||||
|
Administrative expenses |
175 |
236 |
347 |
494 |
|||||
|
Research and development expenses |
360 |
315 |
669 |
638 |
|||||
|
Finance expenses |
(7) |
(8) |
51 |
15 |
|||||
|
Including: Interest expenses |
68 |
49 |
131 |
92 |
|||||
|
Interest income |
27 |
9 |
35 |
16 |
|||||
|
Add: Other income |
40 |
26 |
73 |
83 |
|||||
|
Investment income / (loss) |
(24) |
28 |
(21) |
40 |
|||||
|
Including: Income / (loss) from investments in associates and joint ventures |
(10) |
(2) |
(21) |
(7) |
|||||
|
Gain / (loss) on changes in fair value of financial assets/liabilities |
37 |
(17) |
46 |
(14) |
|||||
|
Credit impairment (loss is expressed by “-“) |
(6) |
2 |
(1) |
(5) |
|||||
|
Asset impairment (loss is expressed by “-“) |
(5) |
(65) |
0 |
(64) |
|||||
|
Gain / (loss) on disposal of assets |
13 |
9 |
16 |
23 |
|||||
|
Operating profit / (loss) |
403 |
713 |
547 |
1,664 |
|||||
|
Add: Non-operating income |
2 |
1 |
3 |
6 |
|||||
|
Less: Non-operating expenses |
0 |
1 |
4 |
1 |
|||||
|
Profit / (loss) before income taxes |
405 |
713 |
546 |
1,669 |
|||||
|
Less: Income tax expenses |
19 |
31 |
50 |
126 |
|||||
|
Net profit / (loss) |
386 |
682 |
496 |
1,543 |
|||||
|
Classified by continuity of operations |
|||||||||
|
Profit / (loss) from continuing operations |
386 |
682 |
496 |
1,543 |
|||||
|
Classified by ownership |
|||||||||
|
Net profit / (loss) attributable to owners of the parent |
386 |
682 |
496 |
1,543 |
|||||
|
Net profit / (loss) attributable to minority shareholders |
0 |
0 |
0 |
0 |
|||||
|
Add: Unappropriated profit at beginning of period |
7,264 |
5,196 |
7,154 |
4,335 |
|||||
|
Less: Cash dividends declared |
358 |
356 |
358 |
356 |
|||||
|
Unappropriated profit at end of period (attributable to owners of the parent) |
7,292 |
5,522 |
7,292 |
5,522 |
|||||
|
Other comprehensive income, net of tax |
481 |
419 |
350 |
386 |
|||||
|
Comprehensive income attributable to owners of the parent |
481 |
419 |
350 |
386 |
|||||
|
Comprehensive income not be reclassified to profit or loss |
6 |
0 |
17 |
0 |
|||||
|
Remeasurement gains or losses of a defined benefit plan |
0 |
0 |
1 |
0 |
|||||
|
Change in the fair value of other equity investments |
6 |
0 |
16 |
0 |
|||||
|
Comprehensive income to be reclassified to profit or loss |
475 |
419 |
333 |
386 |
|||||
|
Comprehensive income using the equity method that may be reclassified to profit or loss |
0 |
(7) |
0 |
(7) |
|||||
|
Cash flow hedge reserve |
0 |
(13) |
0 |
(18) |
|||||
|
Exchange differences of foreign currency financial statements |
475 |
439 |
333 |
411 |
|||||
|
Total comprehensive income |
867 |
1,101 |
846 |
1,929 |
|||||
|
Including: |
|||||||||
|
Total comprehensive income attributable to owners of the parent |
867 |
1,101 |
846 |
1,929 |
|||||
|
Total comprehensive income attributable to minority shareholders |
0 |
0 |
0 |
0 |
|||||
|
Earnings per share |
|||||||||
|
Basic earnings per share |
0.22 |
0.39 |
0.28 |
0.87 |
|||||
|
Diluted earnings per share |
0.22 |
0.39 |
0.28 |
0.87 |
|||||
|
CONSOLIDATED CASH FLOW STATEMENT (Unaudited) |
RMB in millions |
||||||||
|
Three months ended |
Six months ended |
||||||||
|
Jun 30, 2023 |
Jun 30, 2022 |
Jun 30, 2023 |
Jun 30, 2022 |
||||||
|
CASH FLOWS FROM OPERATING ACTIVITIES |
|||||||||
|
Cash receipts from the sale of goods and the rendering of services |
6,178 |
8,184 |
13,162 |
16,999 |
|||||
|
Receipts of taxes and surcharges refunds |
122 |
32 |
216 |
147 |
|||||
|
Other cash receipts relating to operating activities |
110 |
62 |
163 |
132 |
|||||
|
Total cash inflows from operating activities |
6,410 |
8,278 |
13,541 |
17,278 |
|||||
|
Cash payments for goods and services |
4,069 |
5,766 |
8,454 |
11,612 |
|||||
|
Cash payments to and on behalf of employees |
878 |
1,060 |
2,072 |
2,309 |
|||||
|
Payments of all types of taxes and surcharges |
254 |
314 |
466 |
501 |
|||||
|
Other cash payments relating to operating activities |
22 |
93 |
128 |
171 |
|||||
|
Total cash outflows from operating activities |
5,223 |
7,233 |
11,120 |
14,593 |
|||||
|
Net cash flows from operating activities |
1,187 |
1,045 |
2,421 |
2,685 |
|||||
|
CASH FLOWS FROM INVESTING ACTIVITIES |
|||||||||
|
Cash receipts from returns of investments |
4,350 |
4,160 |
8,280 |
5,160 |
|||||
|
Cash receipts from investment income |
38 |
32 |
52 |
38 |
|||||
|
Net cash receipts from disposal of fixed assets, intangible assets and other long-term assets |
7 |
8 |
32 |
34 |
|||||
|
Net cash receipts from disposal of subsidiaries and other business units |
0 |
(1) |
0 |
27 |
|||||
|
Total cash inflows from investing activities |
4,395 |
4,199 |
8,364 |
5,259 |
|||||
|
Cash payments to acquire fixed assets, intangible assets and other long-term assets |
749 |
651 |
1,588 |
1,550 |
|||||
|
Cash payments for investments |
3,200 |
4,310 |
5,980 |
5,960 |
|||||
|
Total cash outflows from investing activities |
3,949 |
4,961 |
7,568 |
7,510 |
|||||
|
Net cash flows from investing activities |
446 |
(762) |
796 |
(2,251) |
|||||
|
CASH FLOWS FROM FINANCING ACTIVITIES |
|||||||||
|
Cash proceeds from investments by others |
230 |
0 |
230 |
0 |
|||||
|
Including: Cash receipts from capital contributions from minority shareholders of subsidiaries |
86 |
0 |
86 |
0 |
|||||
|
Cash receipts from borrowings |
1,317 |
985 |
1,664 |
1,515 |
|||||
|
Total cash inflows from financing activities |
1,547 |
985 |
1,894 |
1,515 |
|||||
|
Cash repayments for debts |
755 |
988 |
1,740 |
1,734 |
|||||
|
Cash payments for distribution of dividends or profit and interest expenses |
414 |
49 |
467 |
90 |
|||||
|
Other cash payments relating to financing activities |
16 |
446 |
48 |
589 |
|||||
|
Total cash outflows from financing activities |
1,185 |
1,483 |
2,255 |
2,413 |
|||||
|
Net cash flows from financing activities |
362 |
(498) |
(361) |
(898) |
|||||
|
EFFECT OF EXCHANGE RATE CHANGES ON CASH AND CASH EQUIVALENTS |
45 |
59 |
37 |
57 |
|||||
|
NET INCREASE IN CASH AND CASH EQUIVALENTS |
2,040 |
(156) |
2,893 |
(407) |
|||||
|
Add: Cash and cash equivalents at beginning of period |
3,306 |
2,512 |
2,453 |
2,763 |
|||||
|
CASH AND CASH EQUIVALENTS AT END OF PERIOD |
5,346 |
2,356 |
5,346 |
2,356 |
|||||
Logo – https://mma.prnewswire.com/media/1711480/JCET_Logo_Logo.jpg
![]() View original content:https://www.prnewswire.co.uk/news-releases/focusing-on-high-performance-advanced-packaging-and-global-layout-jcet-achieved-quarter-on-quarter-growth-in-q2-2023-301910156.html
View original content:https://www.prnewswire.co.uk/news-releases/focusing-on-high-performance-advanced-packaging-and-global-layout-jcet-achieved-quarter-on-quarter-growth-in-q2-2023-301910156.html

Fintech PR
Acceleration of global marketing collaboration between Milk Partners, AirAsia rewards, and The Sandbox

– Milk Partners, AirAsia rewards and The Sandbox are collaborating to provide a new experience allowing users to earn real-world value through the metaverse gaming platform
– Launching metaverse game project ‘MiL.k X BIGGIE Wonderverse’ offering SAND Tokens, Milk Coins and AirAsia points
– “MiL.k is committed to continuously expanding its blockchain ecosystem through strategic partnerships with global partners.”
SEOUL, South Korea, Oct. 23, 2024 /PRNewswire/ — Milk Partners has announced a collaboration with The Sandbox, the global metaverse platform, and AirAsia rewards, the loyalty program of Asia’s leading online travel agency (OTA), AirAsia MOVE. This partnership is set to offer global users an immersive Web3 experience where they can earn rewards with real-world value through engaging in a metaverse-based game.
The newly launched ‘MiL.k X BIGGIE Wonderverse’ metaverse game allows users to earn Sand Tokens, Milk Coins, and AirAsia points. The game is inspired by BIGGIE, the mascot of AirAsia rewards, and modeled after the BIGGIE Wonderland mini-game in the AirAsia MOVE app. Users need to first complete tasks by collecting Milk Coins (symbolized game assets) in the Sandbox metaverse, which can be exchanged for other game assets such as virtual AirAsia points, virtual passports, and virtual boarding passes. Once all tasks are completed, users will then be rewarded with Milk Coins, Sand Tokens, and AirAsia points.
This collaboration has been based on MiL.k’s reliability and strong global network, which has steadily expanded partnerships with major global companies and has become an innovative model for the industry.
This collaboration is part of MiL.k’s broader strategy to expand its blockchain-based loyalty ecosystem, which already includes partnerships with SK OK Cashbag, Lotte L.Point, CU, Megabox, Yanolja, and others. AirAsia rewards operates a comprehensive loyalty platform for the AirAsia group, enhancing its travel and lifestyle businesses, including airlines, online travel agent (OTA), logistics, aviation services, e-commerce, financial services, and more. The Sandbox, a global metaverse platform with over 6 million users, offers a unique space for creating games and generating revenue. Together, AirAsia rewards and The Sandbox will further expand MiL.k’s ecosystem through global partnerships.
The CEO of Milk Partners, Jungmin Cho said “Following our successful collaboration event with CU, we are happy to announce the next event with AirAsia rewards. Through this partnership, for partners, we are providing a new marketing channel on metaverse and for users, we are expecting to share the fun experience and real benefits.” He added, “We will continue to explore various opportunities with global partners across diverse industries.”
In June, MiL.k introduced a metaverse experience ‘Play CUX MiL.k’ with CU and The Sandbox, offering users an engaging new way to explore blockchain and the metaverse. MiL.k is committed to continuously expanding its global partnerships to provide more exciting experiences for global users.
Photo – https://mma.prnewswire.com/media/2536675/image.jpg
![]() View original content:https://www.prnewswire.co.uk/news-releases/acceleration-of-global-marketing-collaboration-between-milk-partners-airasia-rewards-and-the-sandbox-302282640.html
View original content:https://www.prnewswire.co.uk/news-releases/acceleration-of-global-marketing-collaboration-between-milk-partners-airasia-rewards-and-the-sandbox-302282640.html

Fintech PR
H&M Foundation: Global Change Award 2025 launched – with a mission to accelerate innovation for a net-zero textile industry by 2050

STOCKHOLM, Oct. 23, 2024 /PRNewswire/ — The H&M Foundation today announces a significant shift in its overall strategic direction, focus on supporting the textile industry in halving its greenhouse gas emissions every decade by 2050, while promoting a just and fair transition for both people and the planet. The innovation challenge Global Change Award 2025 (GCA) is the first initiative to reflect this shift.
GCA is now seeking innovative ideas addressing different high emission areas across the textile industry value chain, including sustainable materials and processes, responsible production, mindful consumption, and ‘wildcards’ that support the GCA purpose. Today, only a fraction of philanthropic capital is directed to climate.
“The textile industry needs all hands-on deck if we are going to meet our climate goals by 2050, and we must ensure this transition is fair for everyone. I really believe that innovation is key to decarbonising the industry, and that the Global Change Award can play a role in identifying and growing future changemakers whose ideas can have a transformative impact if given the right support,” says Karl-Johan Persson, Board Member of the H&M Foundation.
Since GCA launched in 2015, 46 innovations have received support and a combined grant of 8 million euros. While it continues to award 10 winners every year, with each receiving 200,000 EUR, there are other key updates to the GCA:
- New focus area – decarbonising the textile industry.
- Holistic approach – equipping changemakers with a holistic people and planet mindset.
- Wider range of changemakers – switching to a nomination-based process, instead of an open application system.
- Systems change approach – equipping changemakers to consider the entire textile value chain and its interconnectedness while also considering the impact on people.
“While the industry is hungry for innovation, the holistic perspective to decarbonisation is often lacking, and the critical early stages of an innovator’s journey overlooked – this is where philanthropy can make a real difference”, says Annie Lindmark, Programme Director for Innovation at the H&M Foundation.
In addition to financial support, winners will gain access to a powerful network of mentors, collaborators, and industry leaders to help bring their solutions to life. Together with partners Accenture and KTH Royal Institute of Technology, H&M Foundation will invite the winners to participate in a yearlong, tailormade Changemaker Programme. The Global Change Award 2025 winners will be announced in April 2025.
CONTACT: Jasmina Sofić, Media Relations Responsible, +4673 465 59 59
Photo: https://mma.prnewswire.com/media/2537220/HM_Foundation_Global_Change_Award_25.jpg
Logo: https://mma.prnewswire.com/media/2537258/H_M_Foundation_logo_PNG_black.jpg
![]() View original content:https://www.prnewswire.co.uk/news-releases/hm-foundation-global-change-award-2025-launched—with-a-mission-to-accelerate-innovation-for-a-net-zero-textile-industry-by-2050-302283317.html
View original content:https://www.prnewswire.co.uk/news-releases/hm-foundation-global-change-award-2025-launched—with-a-mission-to-accelerate-innovation-for-a-net-zero-textile-industry-by-2050-302283317.html

Exclusive tech event will convene business leaders, investors and thought leaders in 2025
LAGUNA BEACH, Calif., Oct. 22, 2024 /PRNewswire/ — Dow Jones announced today the expansion of WSJ Tech Live through a multi-year agreement that will bring the marquee event to the State of Qatar starting next year. Appearing on stage at this year’s event in Laguna Beach, Calif., Sheikh Jassim bin Mansour bin Jabor Al Thani, Director of the Government Communications Office of the State of Qatar, and Almar Latour, publisher of The Wall Street Journal and CEO of Dow Jones, jointly announced that WSJ Tech Live Qatar will debut in late 2025 and take place annually for five years.
This marks the first time WSJ’s most exclusive tech event will be held in the Middle East. The invitation-only conference will bring together an audience of over 200 C-suite executives, investors, innovative startups and influential venture capitalists from across the world. Dow Jones will continue to operate WSJ Tech Live annually in California while adding WSJ Tech Live Qatar to the calendar starting in December 2025.
Sheikh Jassim highlighted that the conference aligns with Qatar’s vision to become a global hub for advanced technology and innovation, as outlined in the Third National Development Strategy and Qatar National Vision 2030.
“Hosting WSJ Tech Live marks another significant step in the growth of Qatar’s technology ecosystem,” said Sheikh Jassim. “When the world’s top tech leaders gather in Qatar, it will create an unparalleled opportunity to benefit from their diverse expertise, insights and global networks. This will inspire local talent, attract international investment, and create avenues for strategic global partnerships that propel our development journey forward.”
“Dow Jones and The Wall Street Journal deliver reliable journalism, data, and analytics to business professionals worldwide, and to do so we must reflect the entire global business community,” said Latour. “With the MENA region’s growth and increased role in tech–especially at the intersection of AI and the energy sector–we are delighted to be partnering with Qatar.”
Currently in its 11th year, WSJ Tech Live convenes the biggest newsmakers in technology across entertainment, music, robotics and AI, science and more. This year’s marquee event is the company’s most successful Tech Live since its inception, with record-breaking sponsorship revenue. The event showcased groundbreaking insights on a wide range of topics including the global impact of generative AI, the future of brain-computer interfaces, the outlook for startup investments, fostering the next generation of technology talent and how the upcoming U.S. election could impact the tech industry.
WSJ Tech Live joins a series of global events hosted in Qatar, including the FIFA World Cup™, Web Summit Qatar, Formula 1 Qatar Grand Prix, and Doha Forum. The event also builds on Dow Jones’s existing presence in MENA, which serves as an important hub for reporting from The Wall Street Journal, and home to key sales and services functions.
About Dow Jones
Dow Jones is a global provider of news and business information, delivering content to consumers and organizations around the world across multiple formats, including print, digital, mobile and live events. Dow Jones has produced unrivaled quality content for more than 130 years and today has one of the world’s largest news-gathering operations globally. It is home to leading publications and products including the flagship Wall Street Journal, America’s largest newspaper by paid circulation; Barron’s, MarketWatch, Mansion Global, Financial News, Investor’s Business Daily, Factiva, Dow Jones Risk & Compliance, Dow Jones Newswires, OPIS and Chemical Market Analytics. Dow Jones is a division of News Corp (Nasdaq: NWS, NWSA; ASX: NWS, NWSLV).
About the Government Communications Office of the State of Qatar
The Government Communications Office was established in 2015 to serve as the strategic communications arm of the State of Qatar. It coordinates communications activities across government and public-sector institutions, showcasing the country’s vision, initiatives and achievements in line with the Qatar National Vision 2030.
View original content:https://www.prnewswire.co.uk/news-releases/dow-jones-to-expand-wsj-tech-live-event-to-qatar-302283664.html


-

 Fintech PR7 days ago
CoinDesk bolsters information services offering with strategic acquisition of CCData and CryptoCompare
-
 Fintech PR6 days ago
EQT Exeter Real Estate Income Trust acquires 200,000 square-foot industrial property in Seattle for over $80M, bringing total capital deployed to approximately $390M since inception
-
 Fintech PR7 days ago
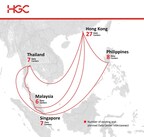
HGC Global Communications Launches Data Center Interconnect Clusters to Transform Connectivity Across Asia
-

 Fintech PR5 days ago
Kroll Liquidators Secured Multi-Million Dollar Settlement Between Emergent Fidelity Technologies and FTX Estate Approved by US Bankruptcy Court
-

 Fintech1 day ago
Fintech Pulse: Your Daily Industry Brief – Market Moves, Platform Innovations, and Strategic Shifts
-
Fintech PR4 days ago
Deepening International Friendship and Cooperation! The 6th China-CEEC Local Leaders’ Meeting Held in Yantai
-

 Fintech PR5 days ago
Race to the Top: Bybit Adds $1 Million to WSOT 2024 Prize Pool – Final Days to Register!
-

 Fintech PR7 days ago
Manulife and World Economic Forum Announce Winners in ‘Prospering in Longevity Challenge’ to Drive Health and Financial Resiliency